Equities Risk
More details on economic factor mimicking portfolios
Synopsis
Here we present more details on the return characteristics of the factor mimicking portfolios designed to capture the influence of economic factors. The portfolios are formed every December by sorting the universe of All Ordinaries Index stocks into terciles based on their loadings on the factor of interest. Each stock's loadings are calculated via exponentially-weighted moving average time-series regressions over the previous five years with decay parameter λ = 0.95. The factor mimicking portfolio returns are the monthly return spread between the top tercile portfolio and the bottom tercile portfolio. Relative volatility is the ratio of the factor mimicking portfolio volatility to the volatility of the return spread of randomly assigned tercile portfolios.
| Factor | Minimum | 25th percentile | 75th percentile | Maximum | Standard deviation | Relative volatility |
|---|---|---|---|---|---|---|
| Commodity beta | -0.186 | -0.030 | 0.029 | 0.165 | 0.056 | 2.850 |
| TWI beta | -0.196 | -0.039 | 0.029 | 0.154 | 0.054 | 2.736 |
| Market beta | -0.183 | -0.036 | 0.028 | 0.167 | 0.052 | 2.627 |
| Interest rate beta | -0.154 | -0.026 | 0.022 | 0.091 | 0.038 | 1.919 |
Sensitivity to commodity prices, exchange rates and market returns appear to be strong drivers of return differentials in Australian equities. Sensitivity to interest rate changes appears to be relatively less important.
Factor mimicking portfolio total return indices
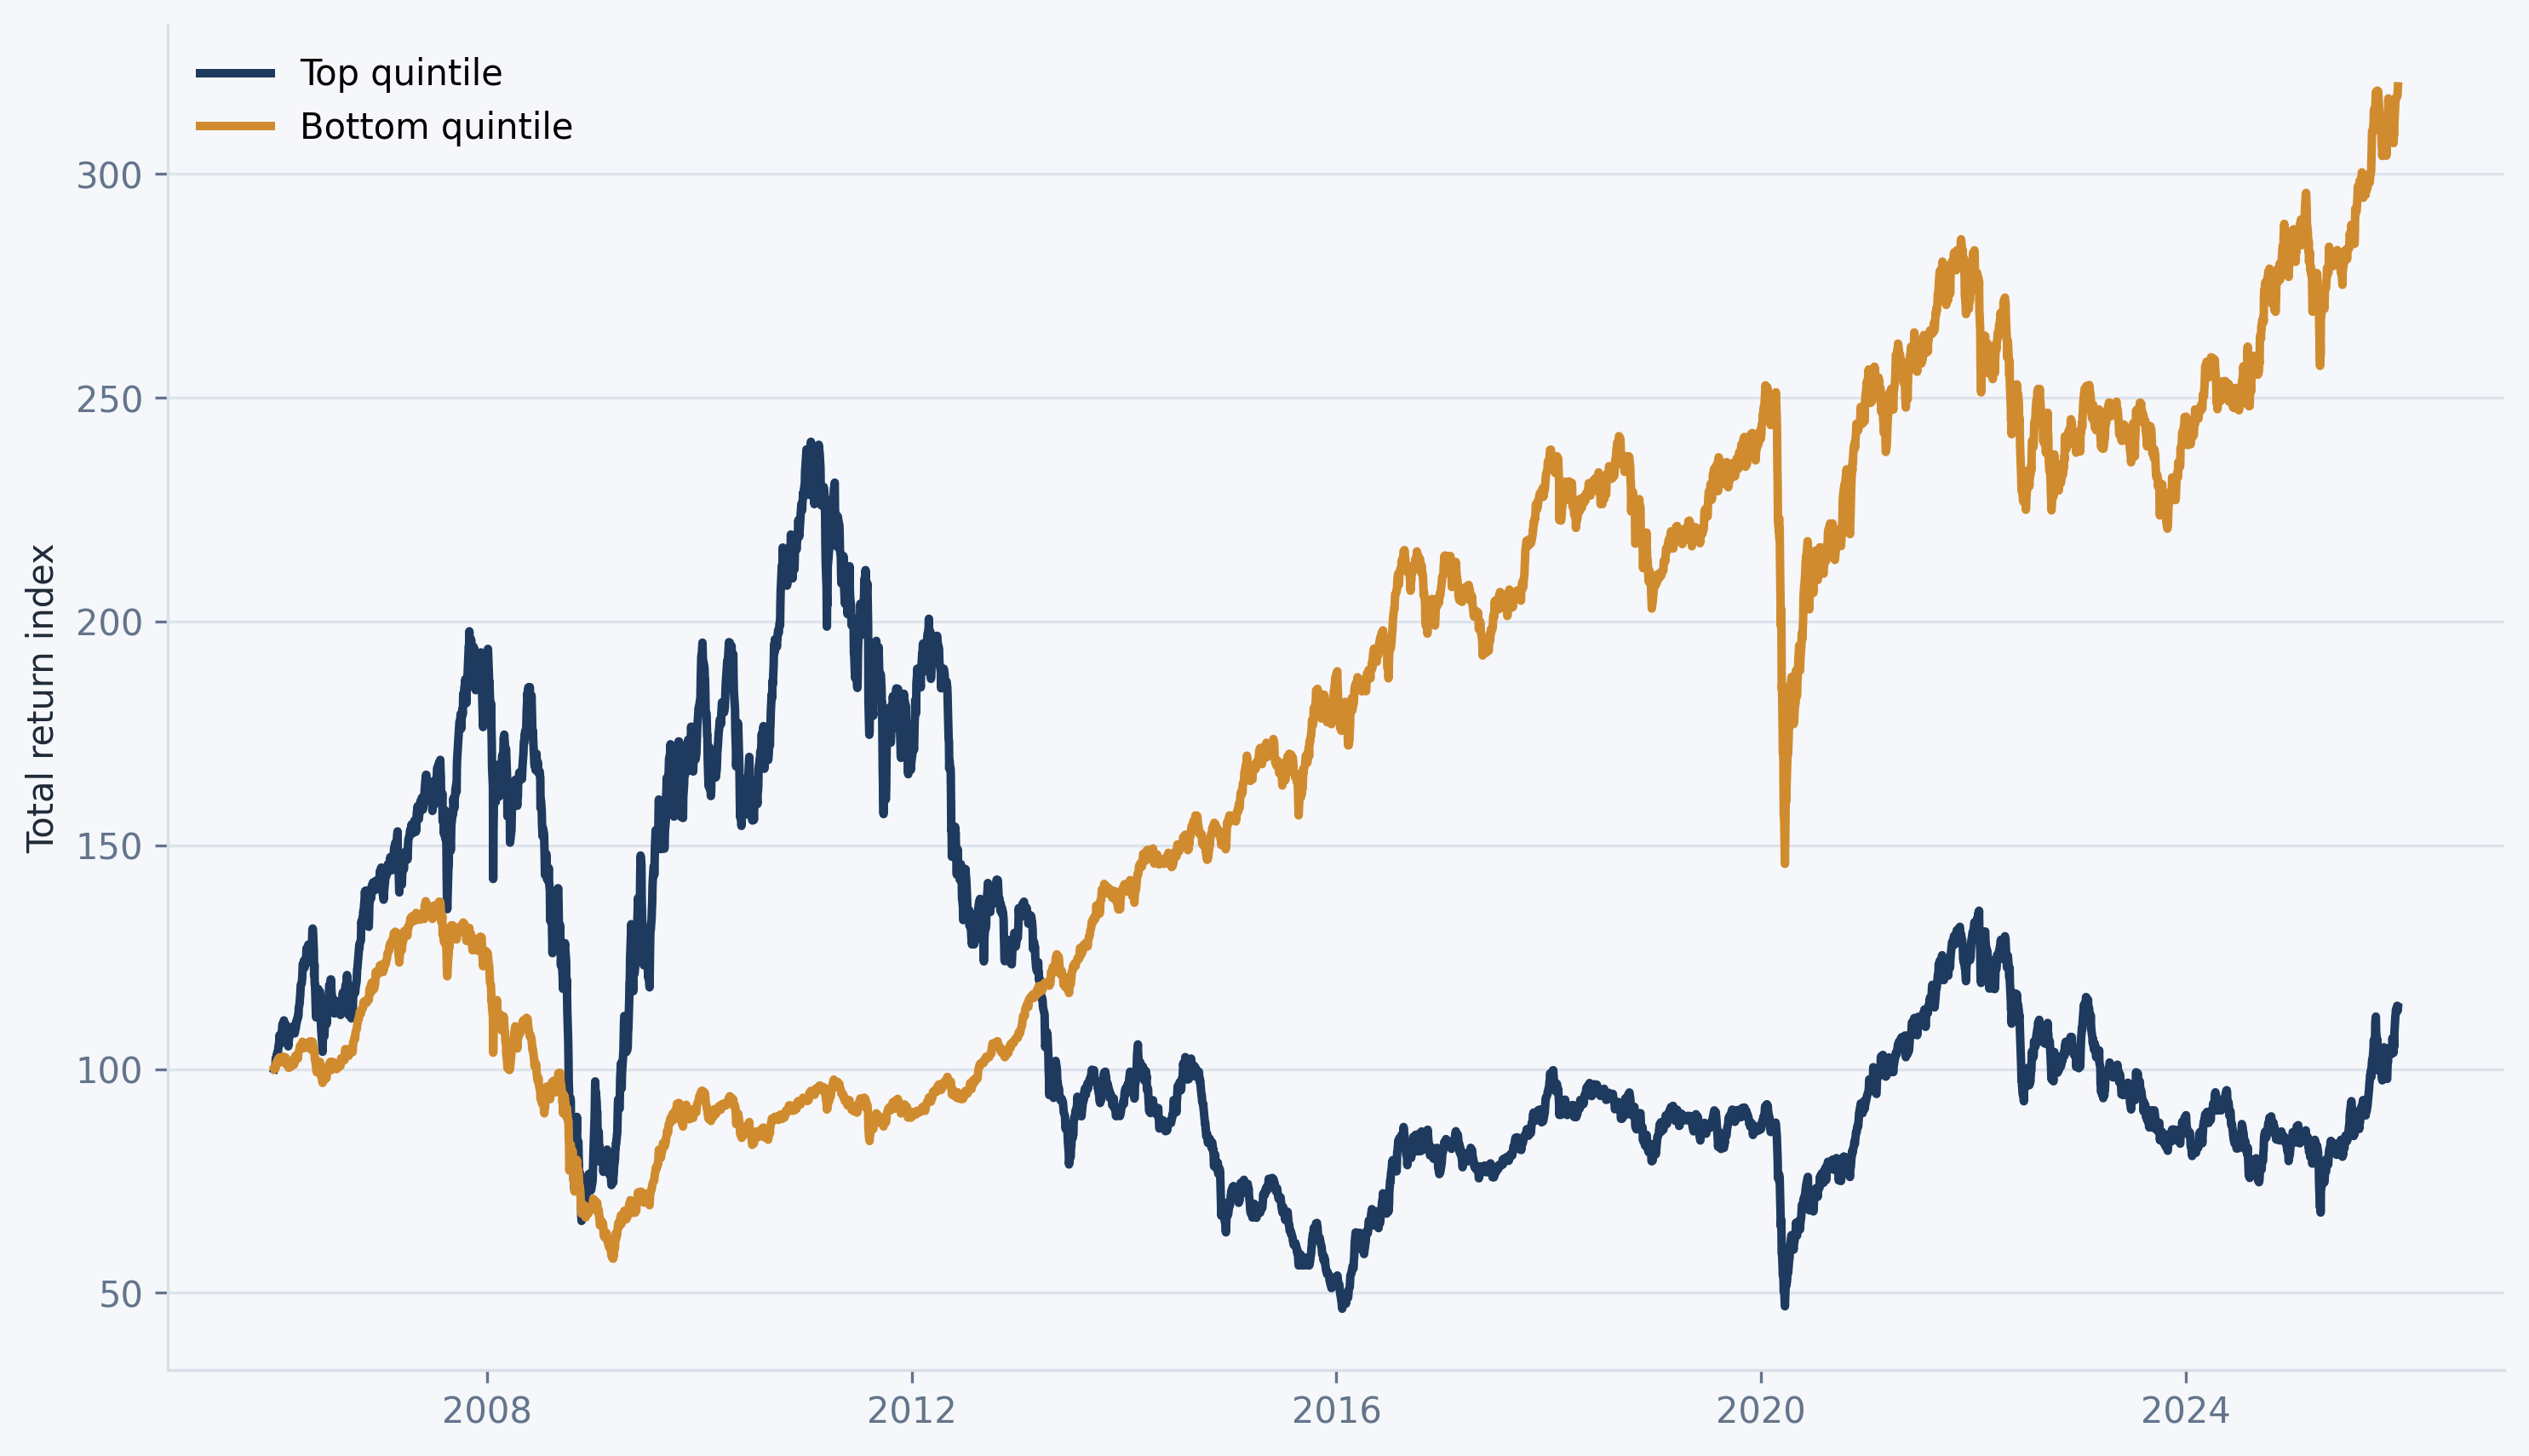
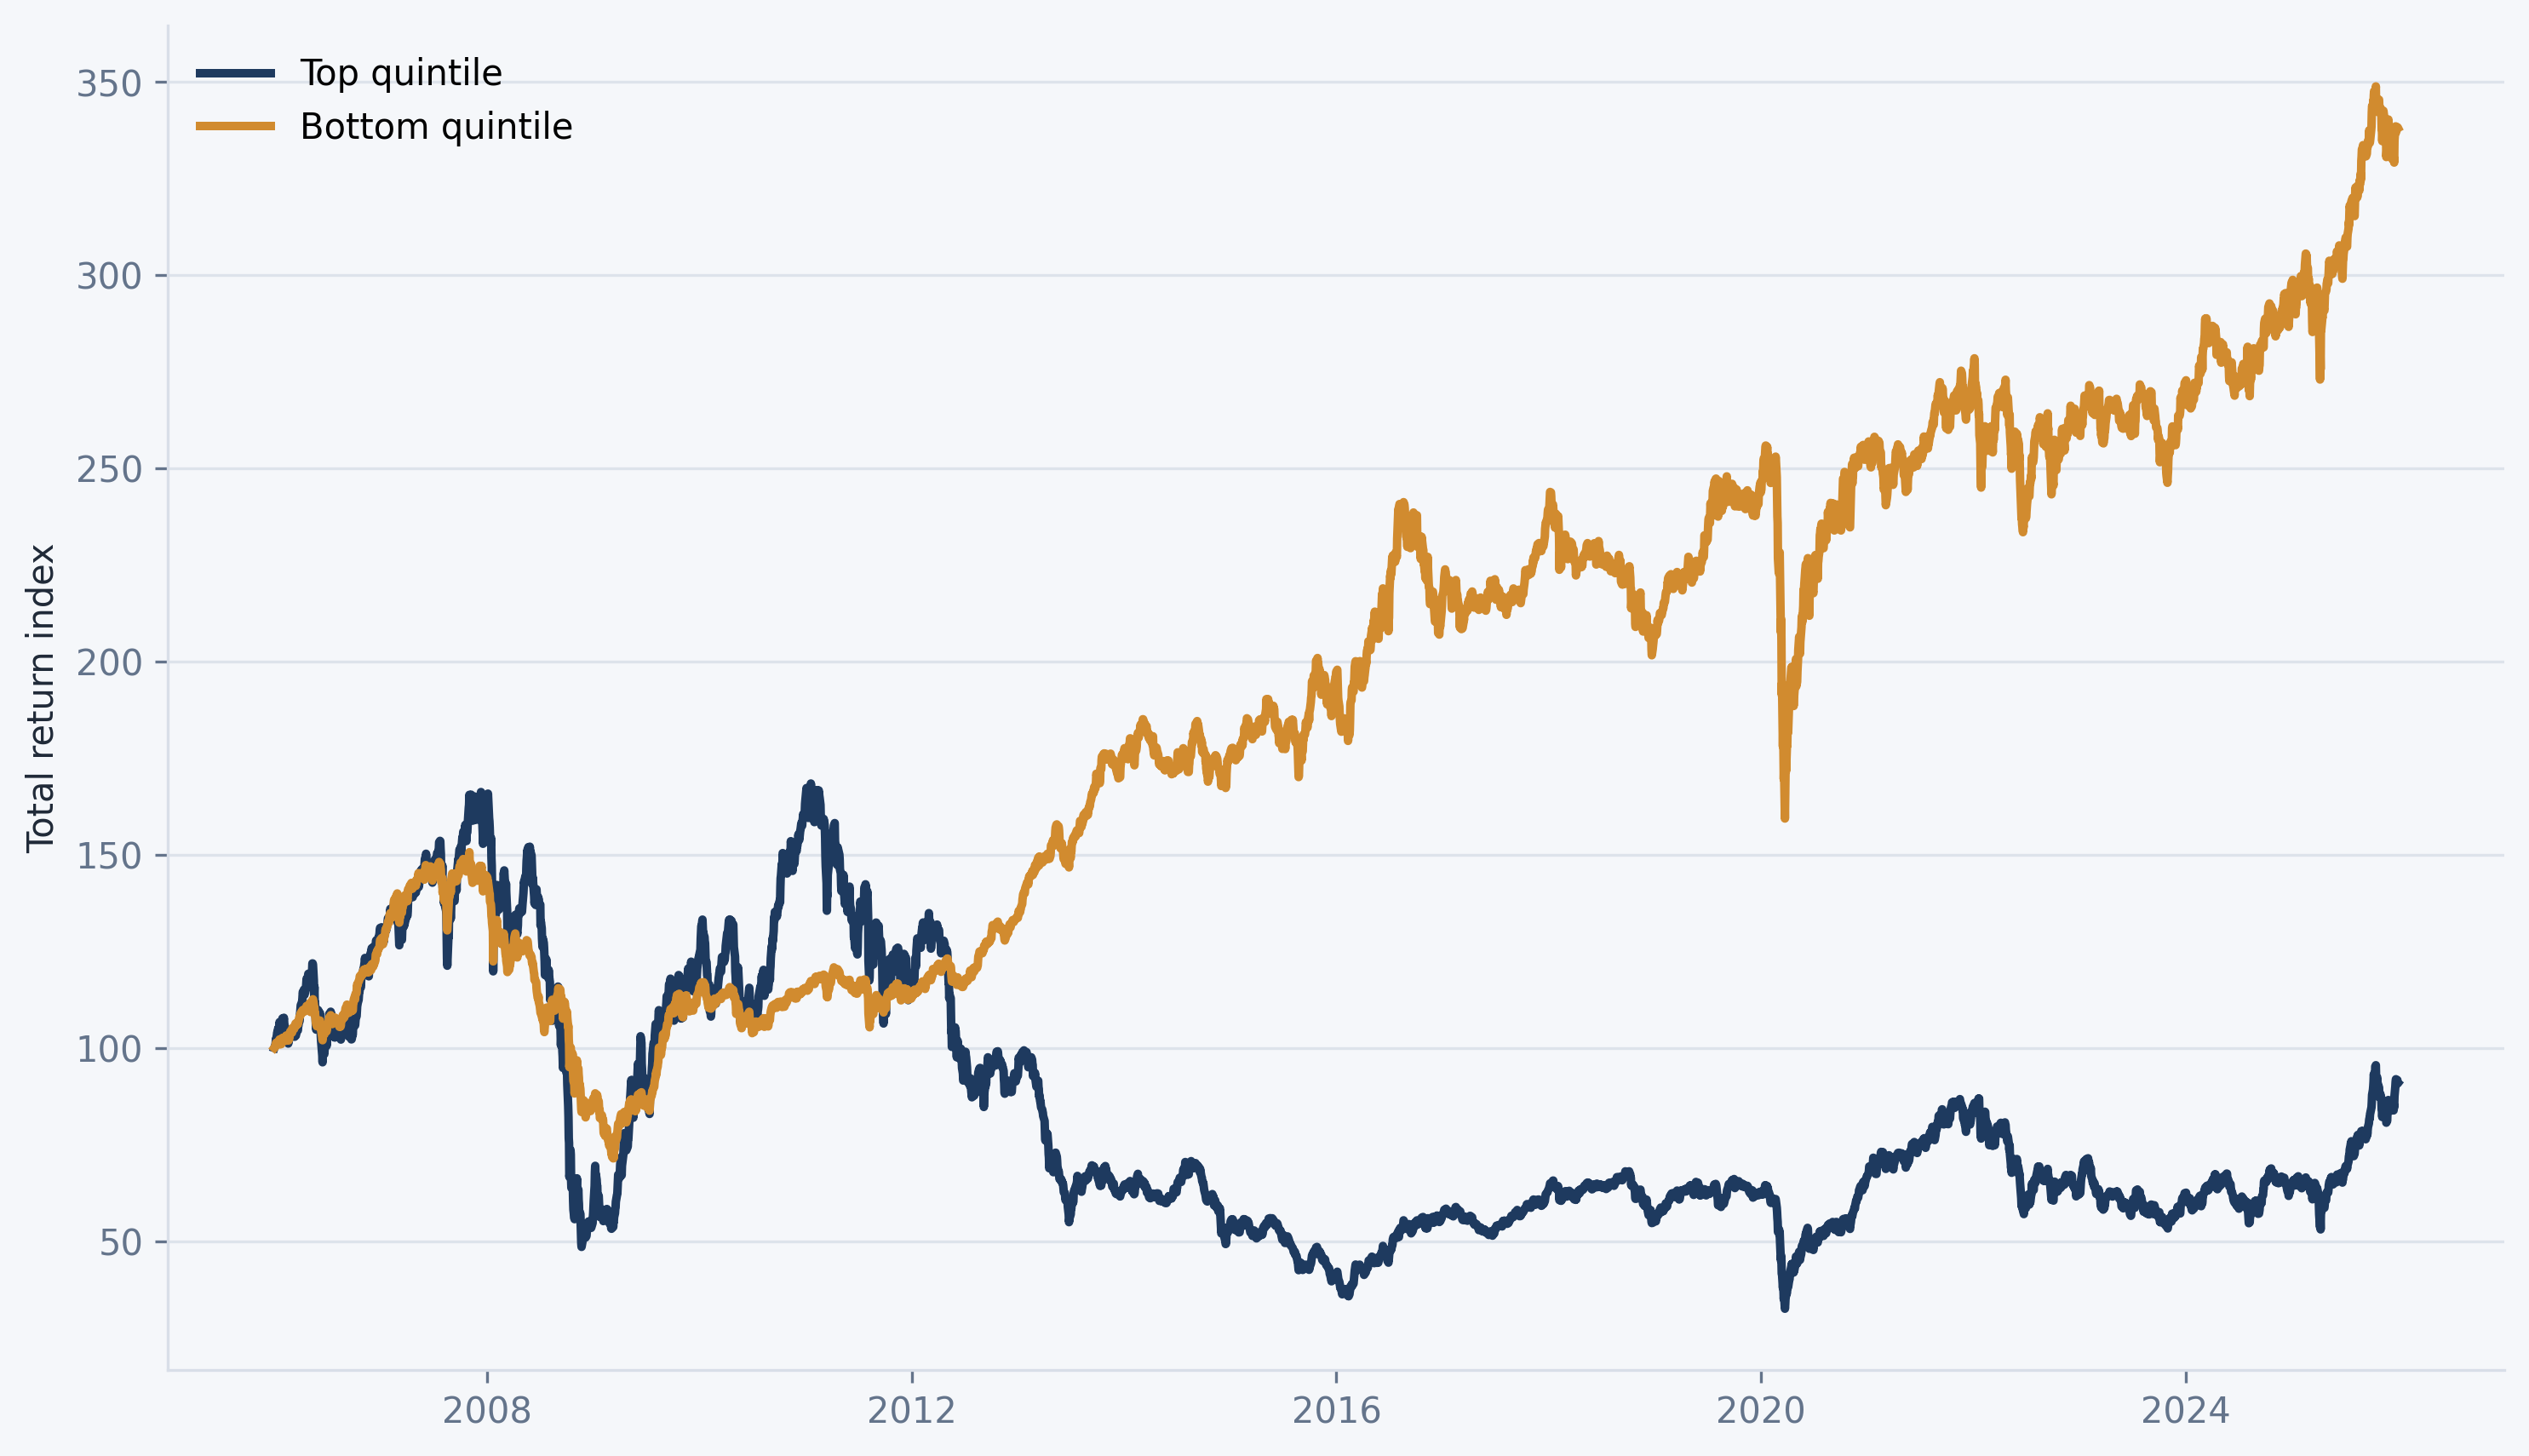
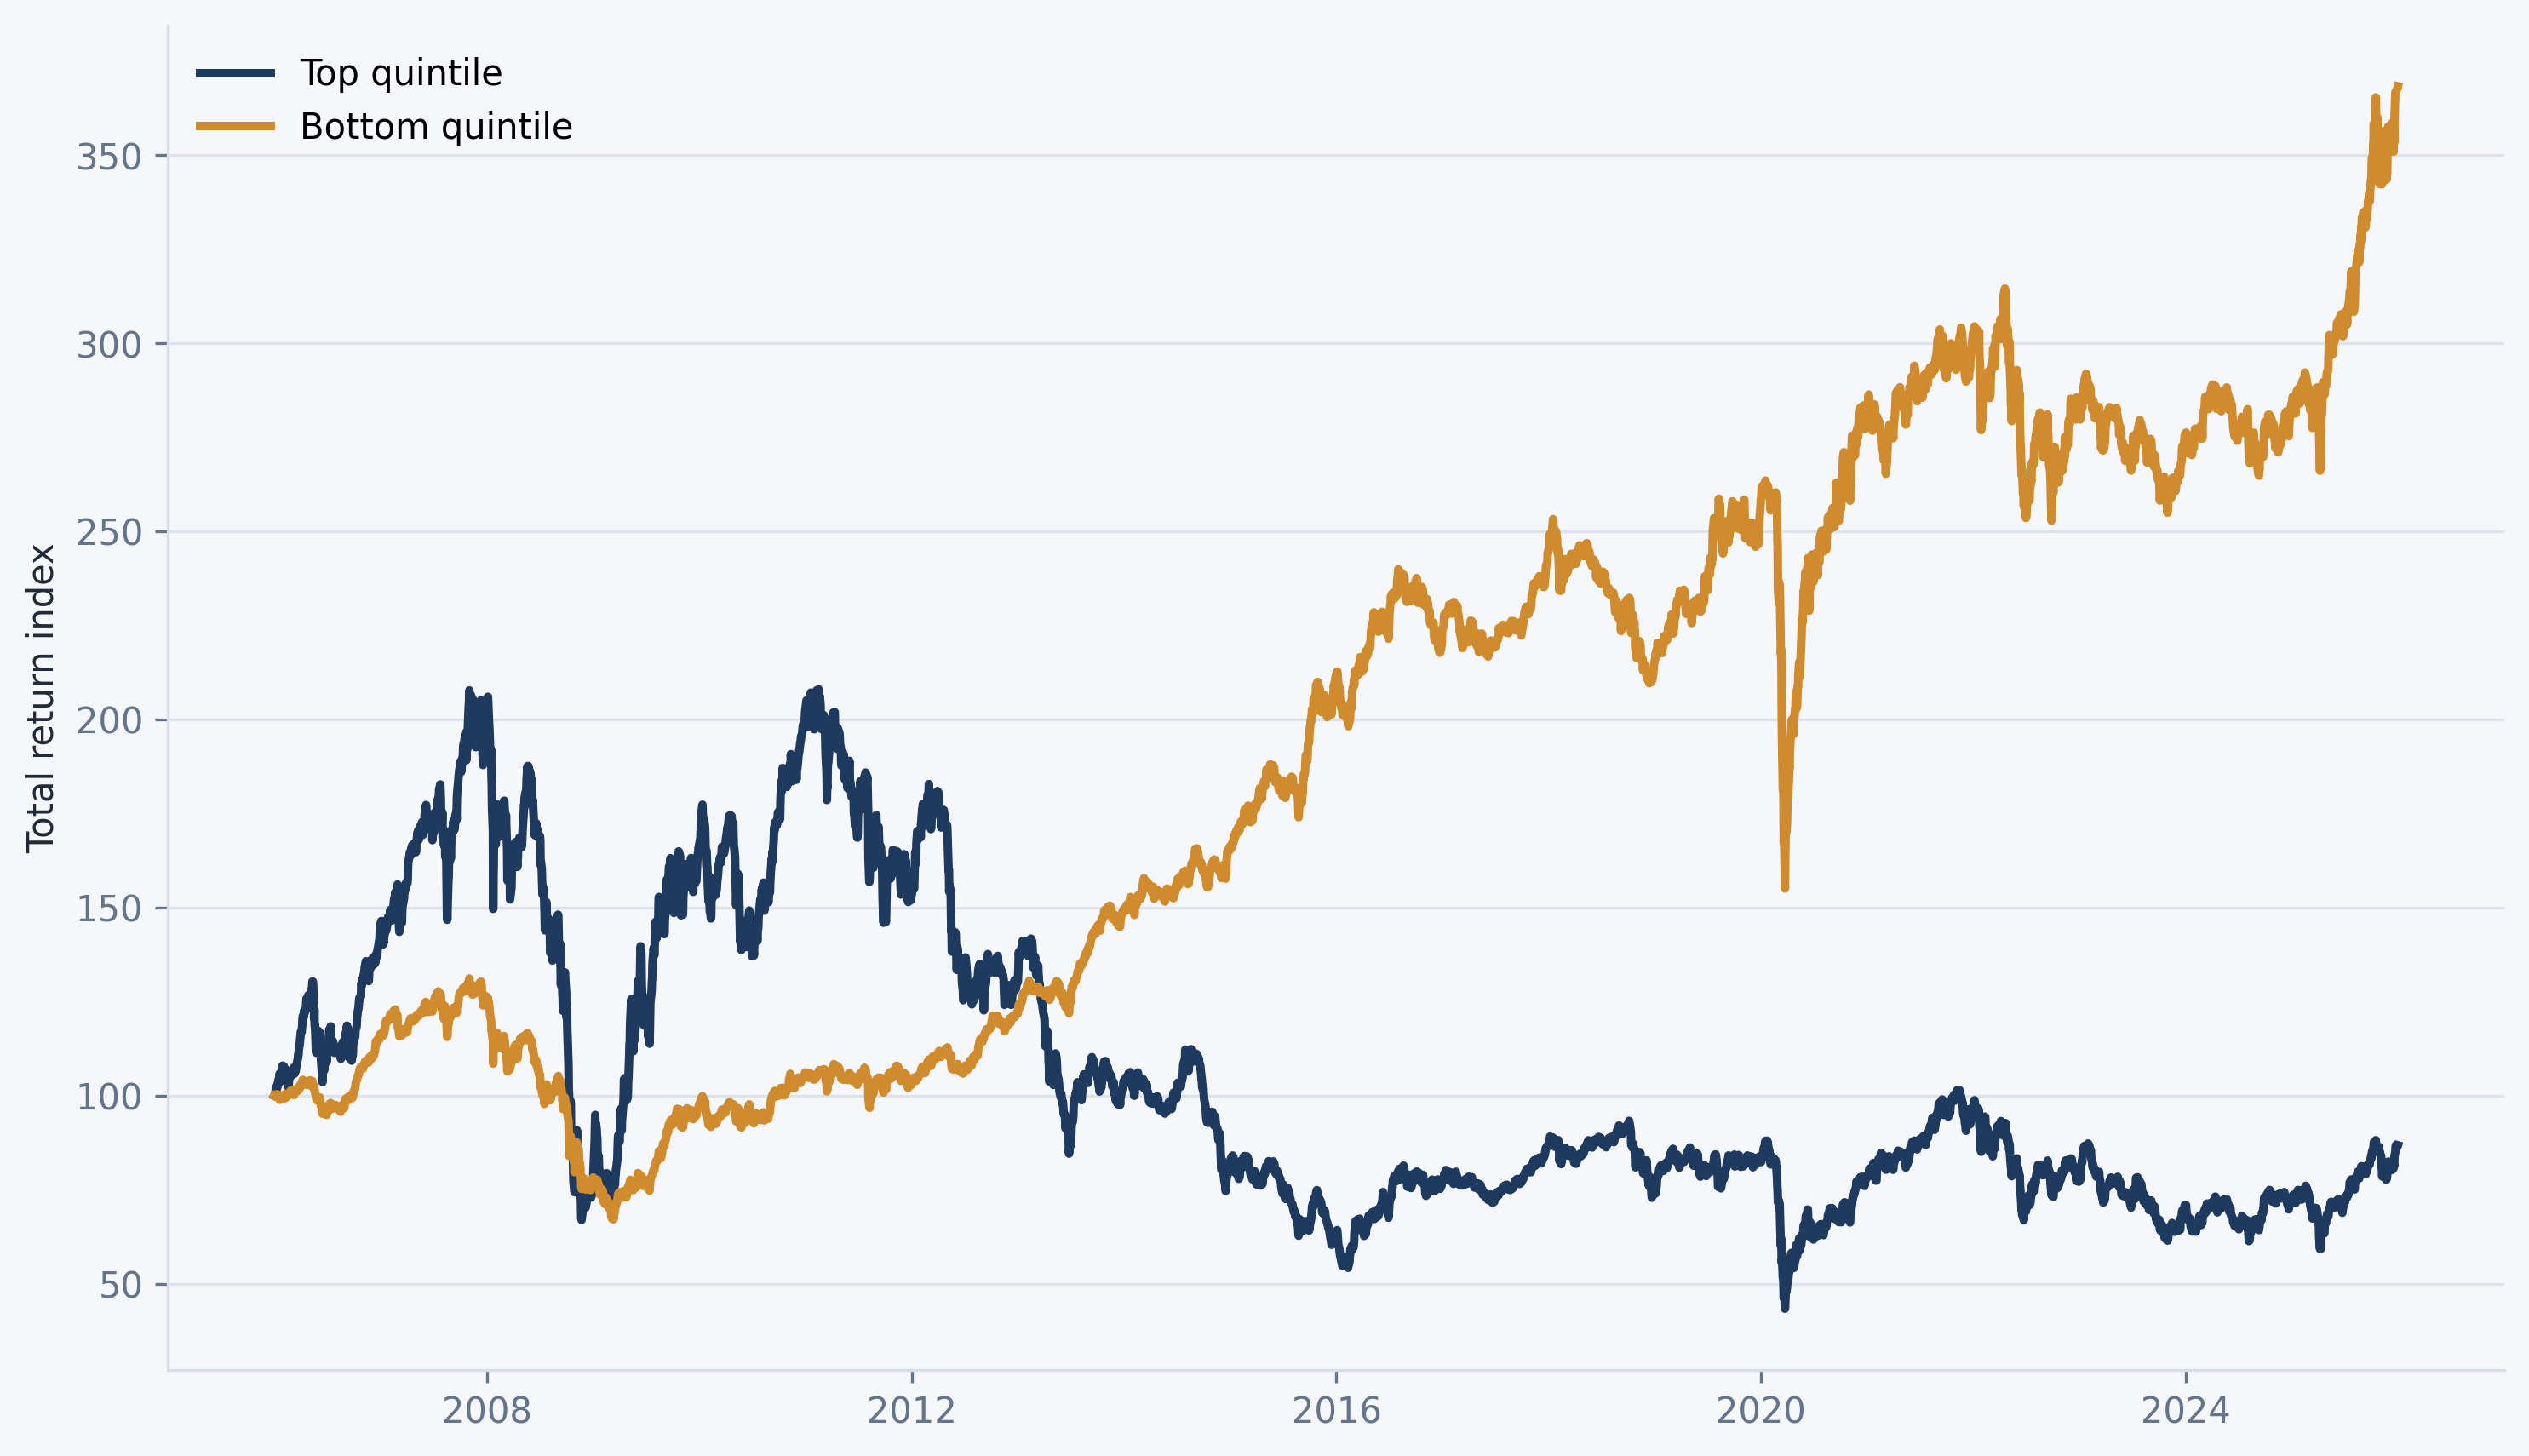
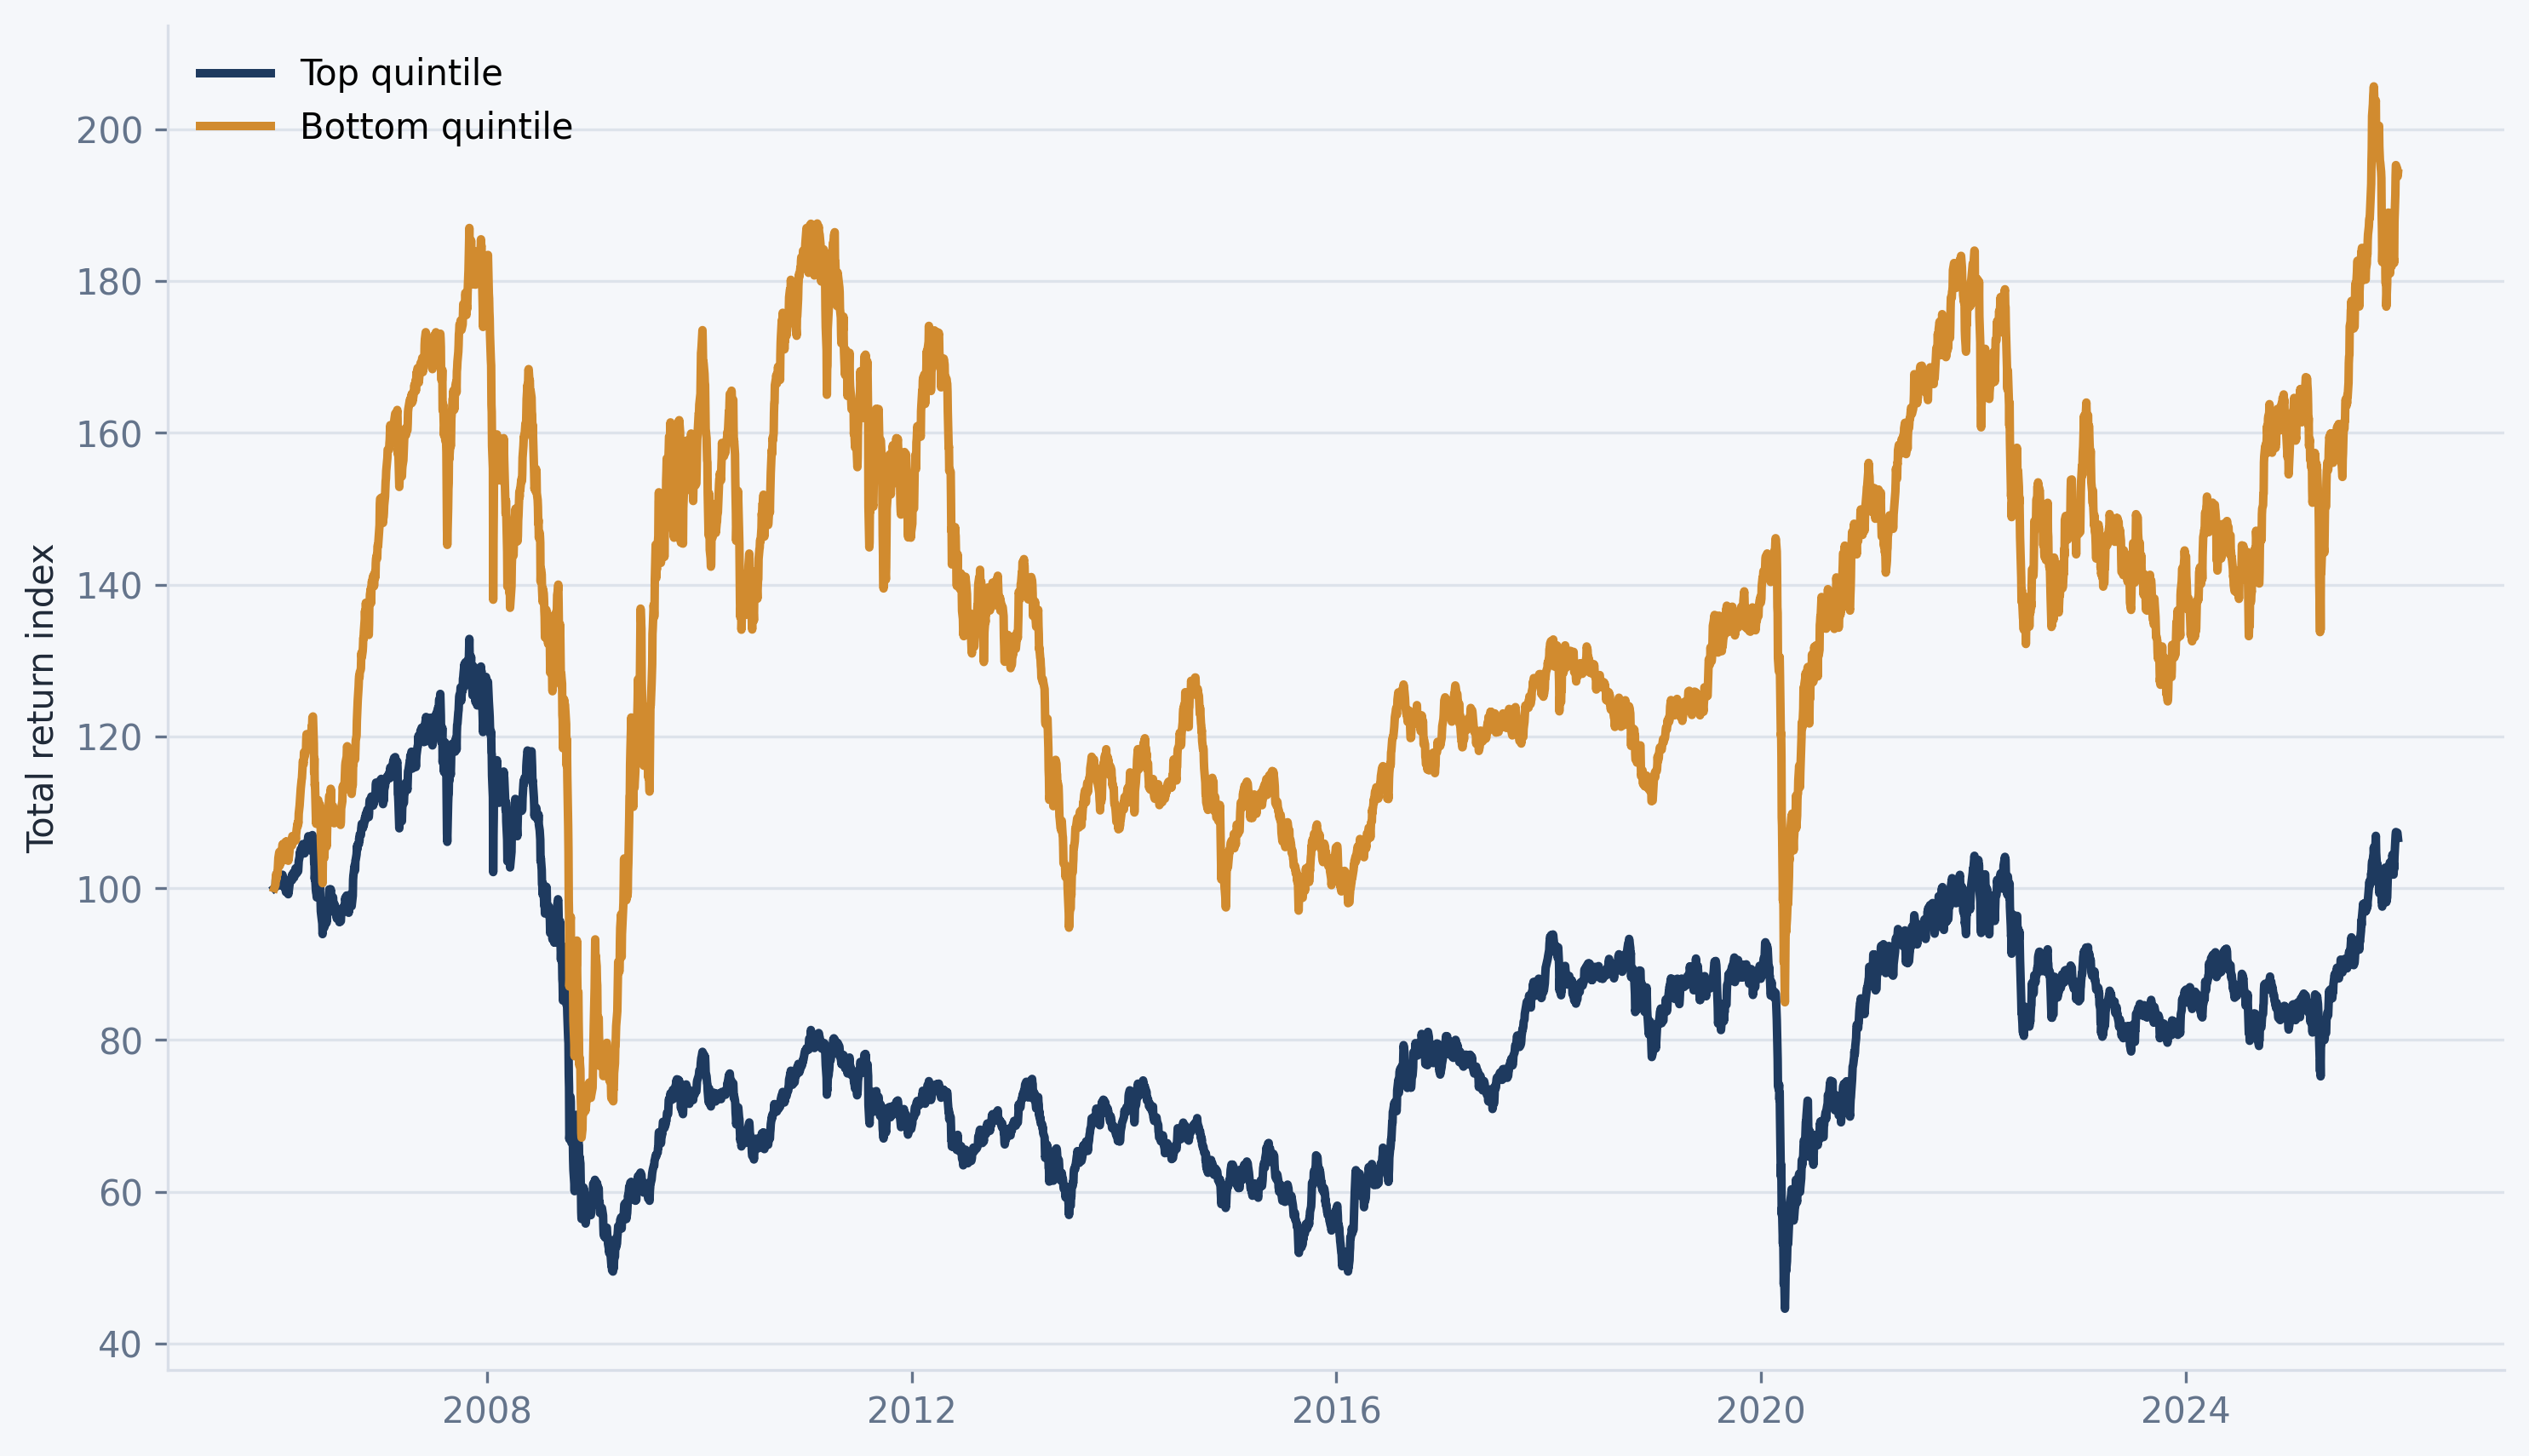
Commodity beta is the time-series loading on the Bloomberg Commodity Index return; TWI beta is the time-series loading on the return of the trade-weighted index of currencies against the AUD; Market beta is the time-series loading on the All Ordinaries Accumulation Index return; Interest rate beta is the time-series loading on changes in yield spread between 10-year and 2-year government bonds.