Equities Risk
More details on value, growth and profitability factor mimicking portfolios
Synopsis
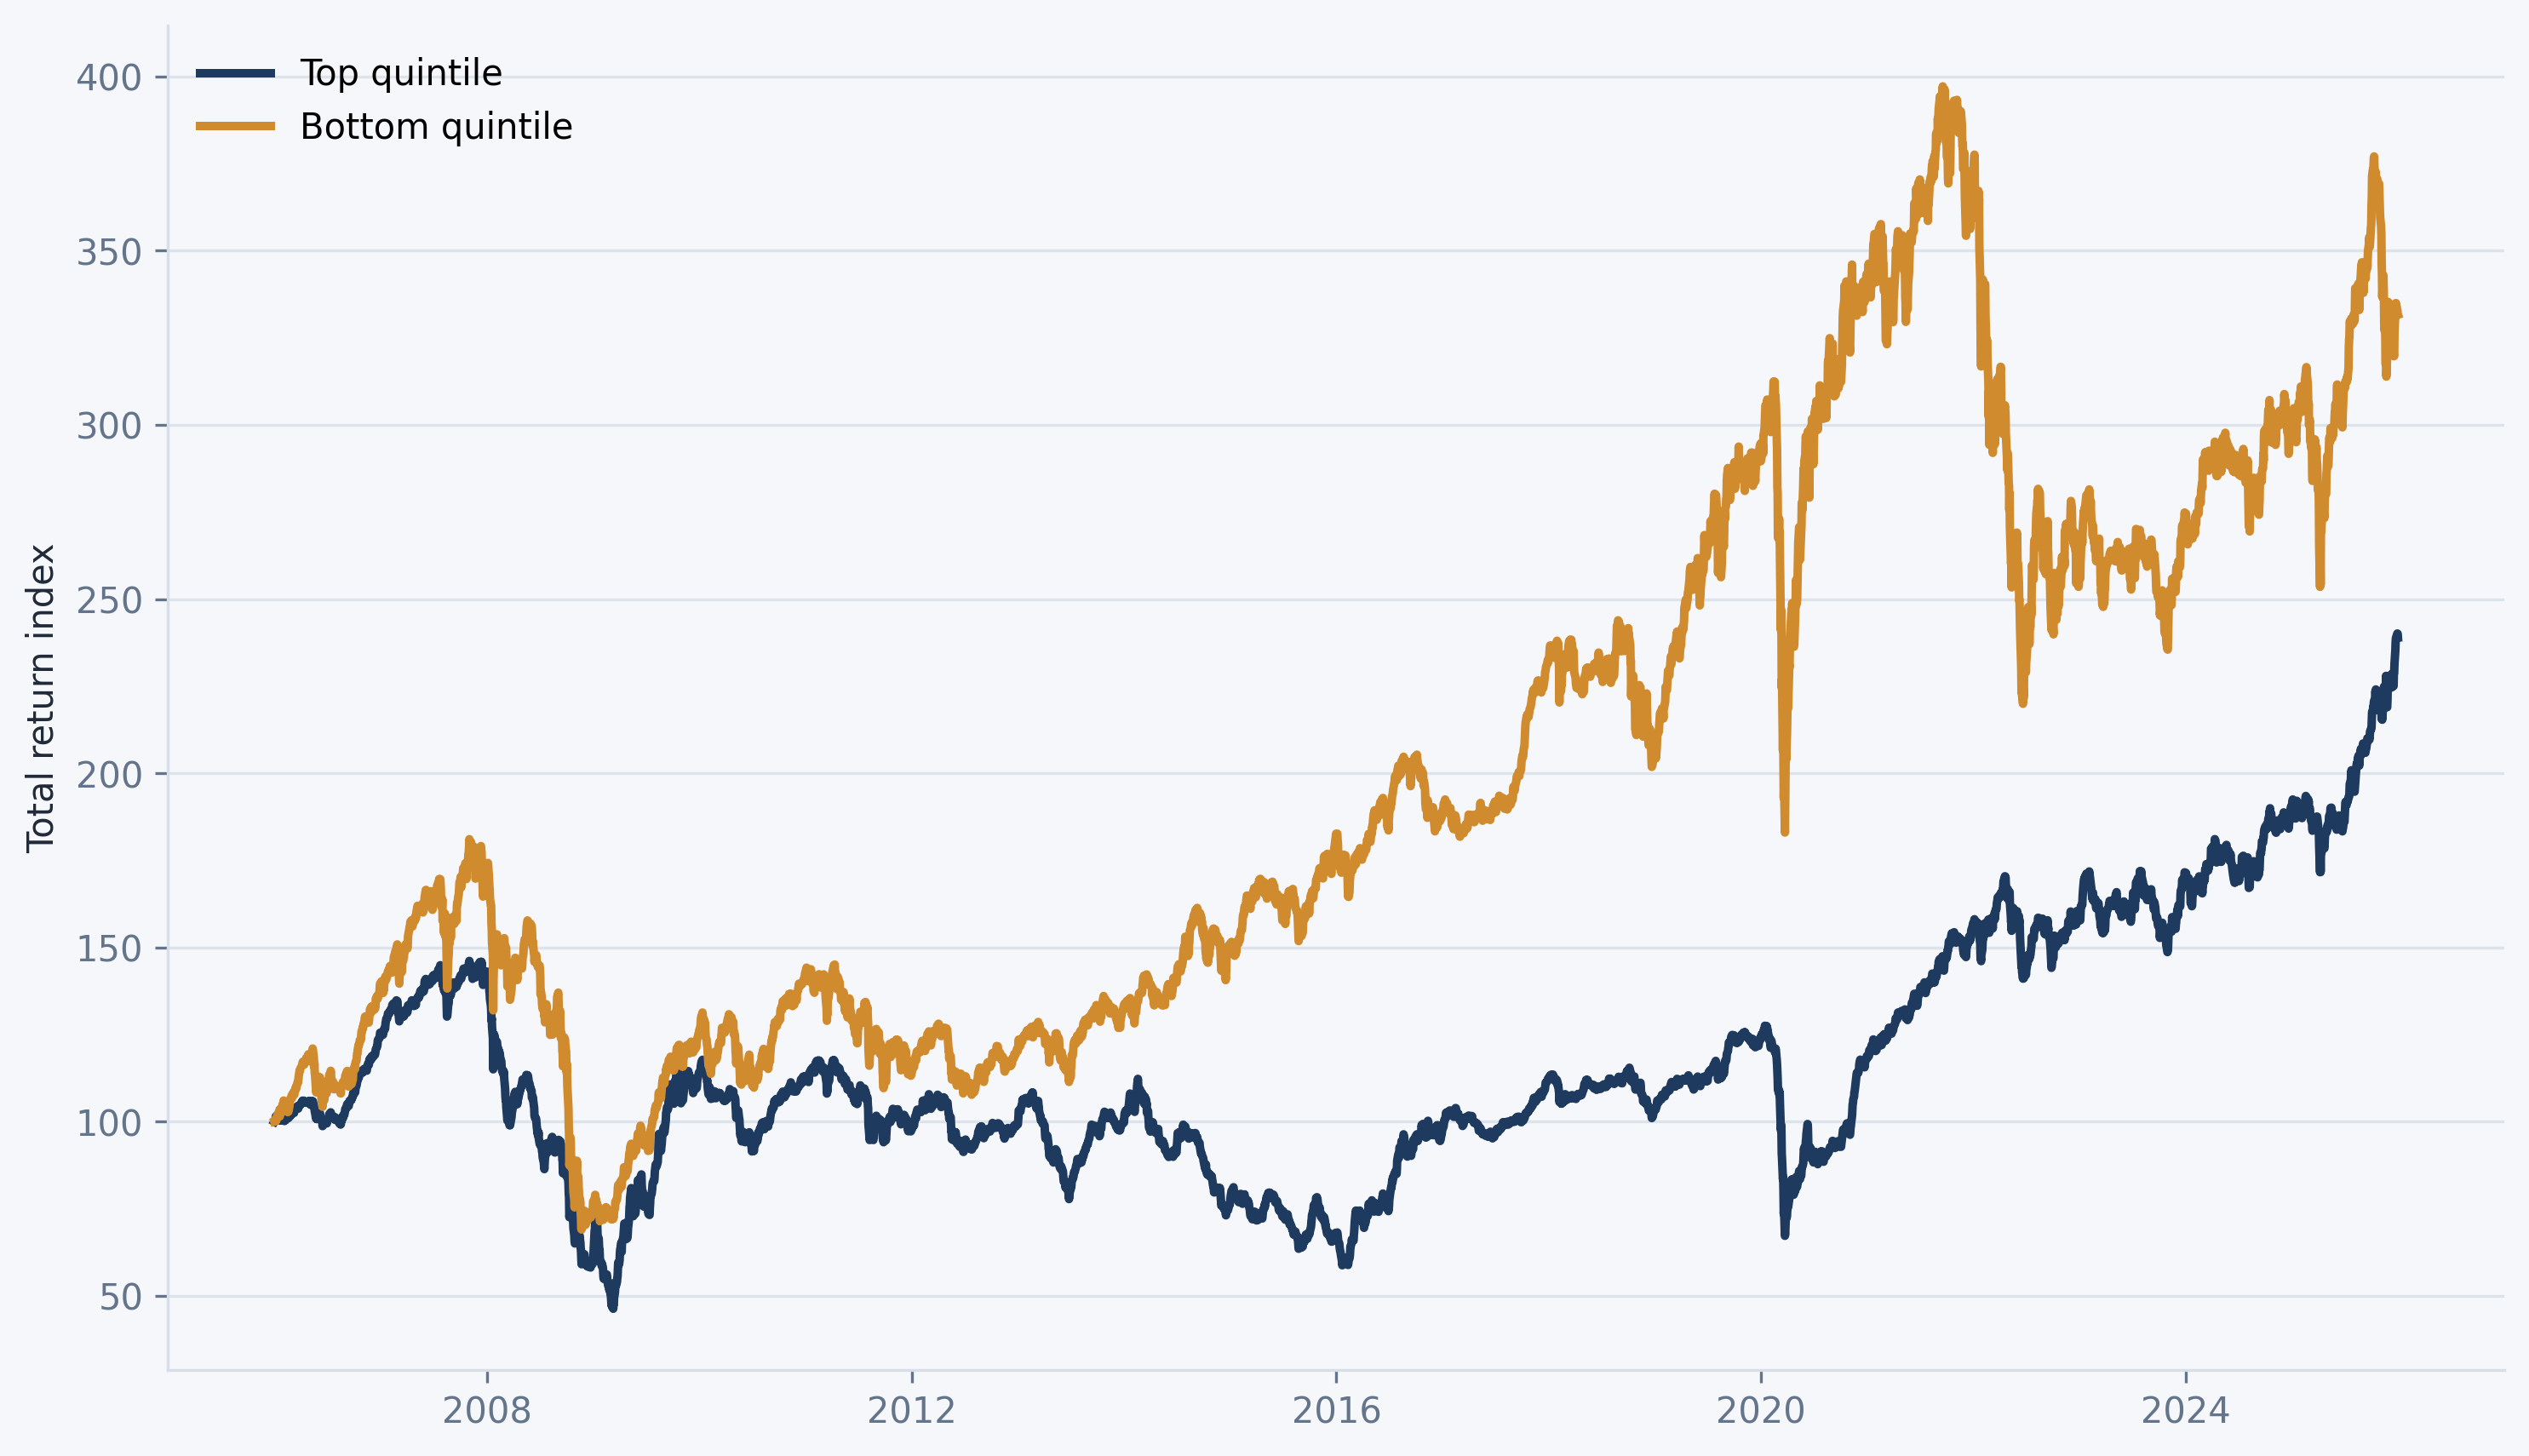
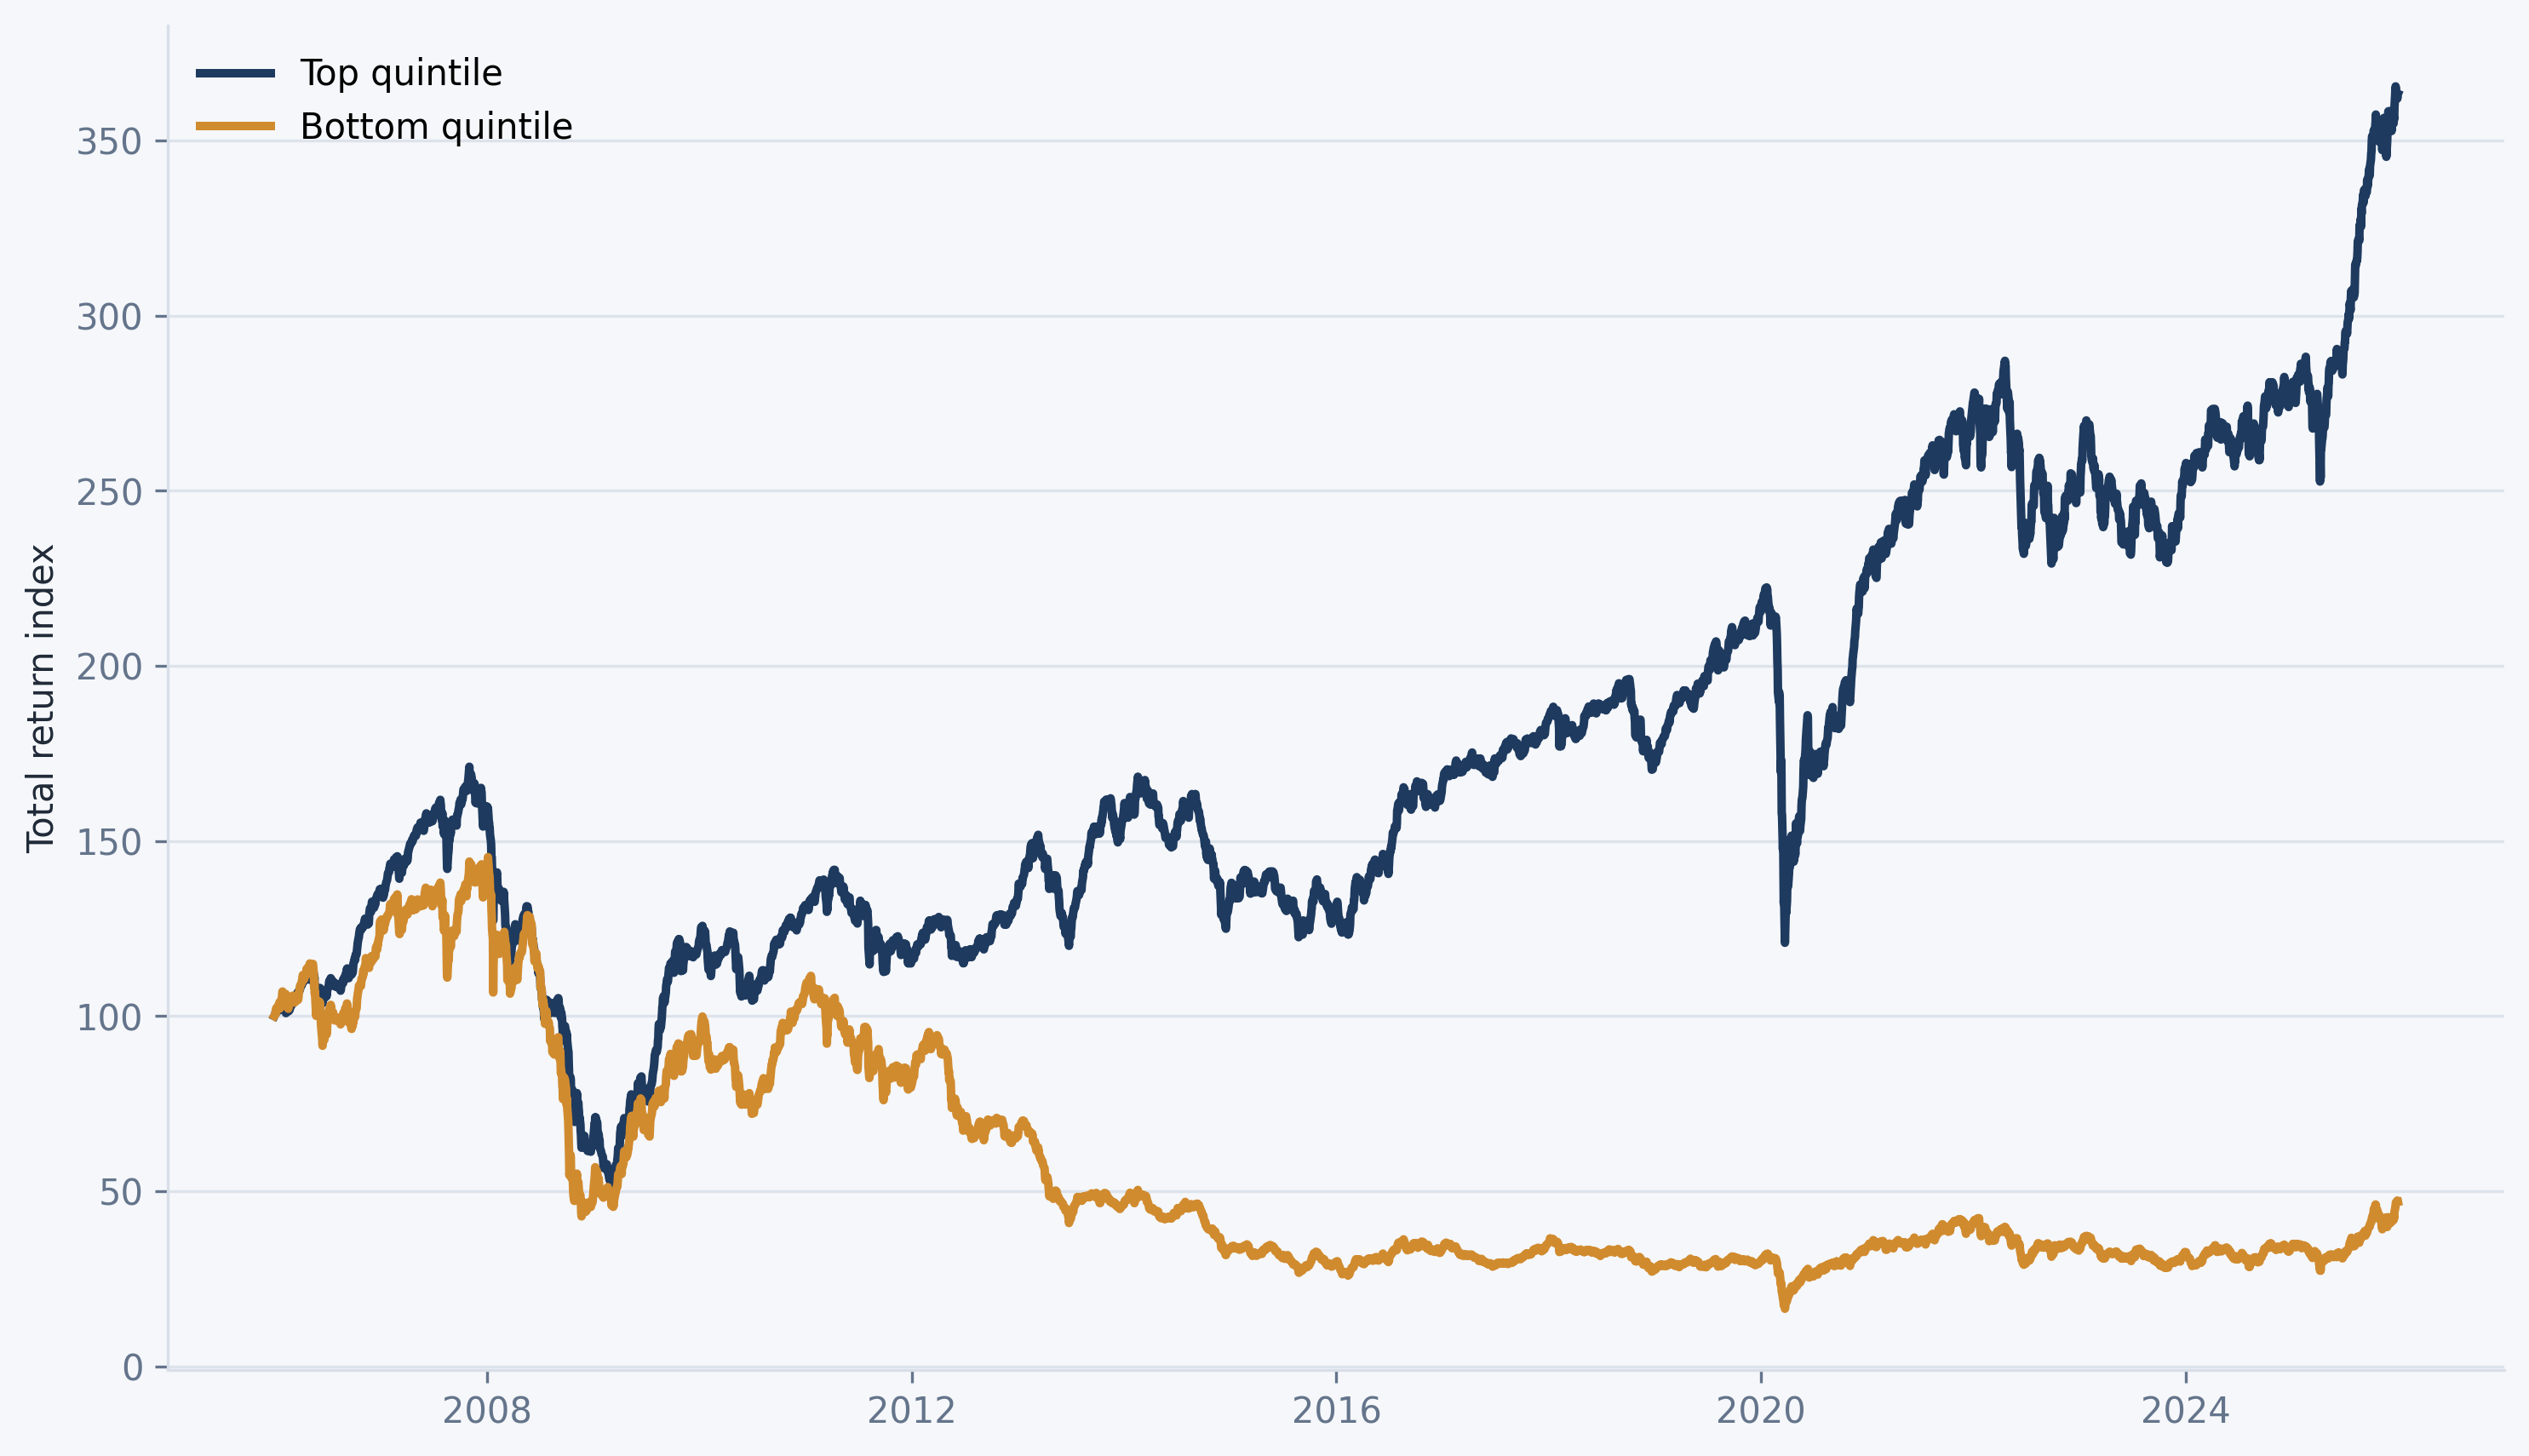
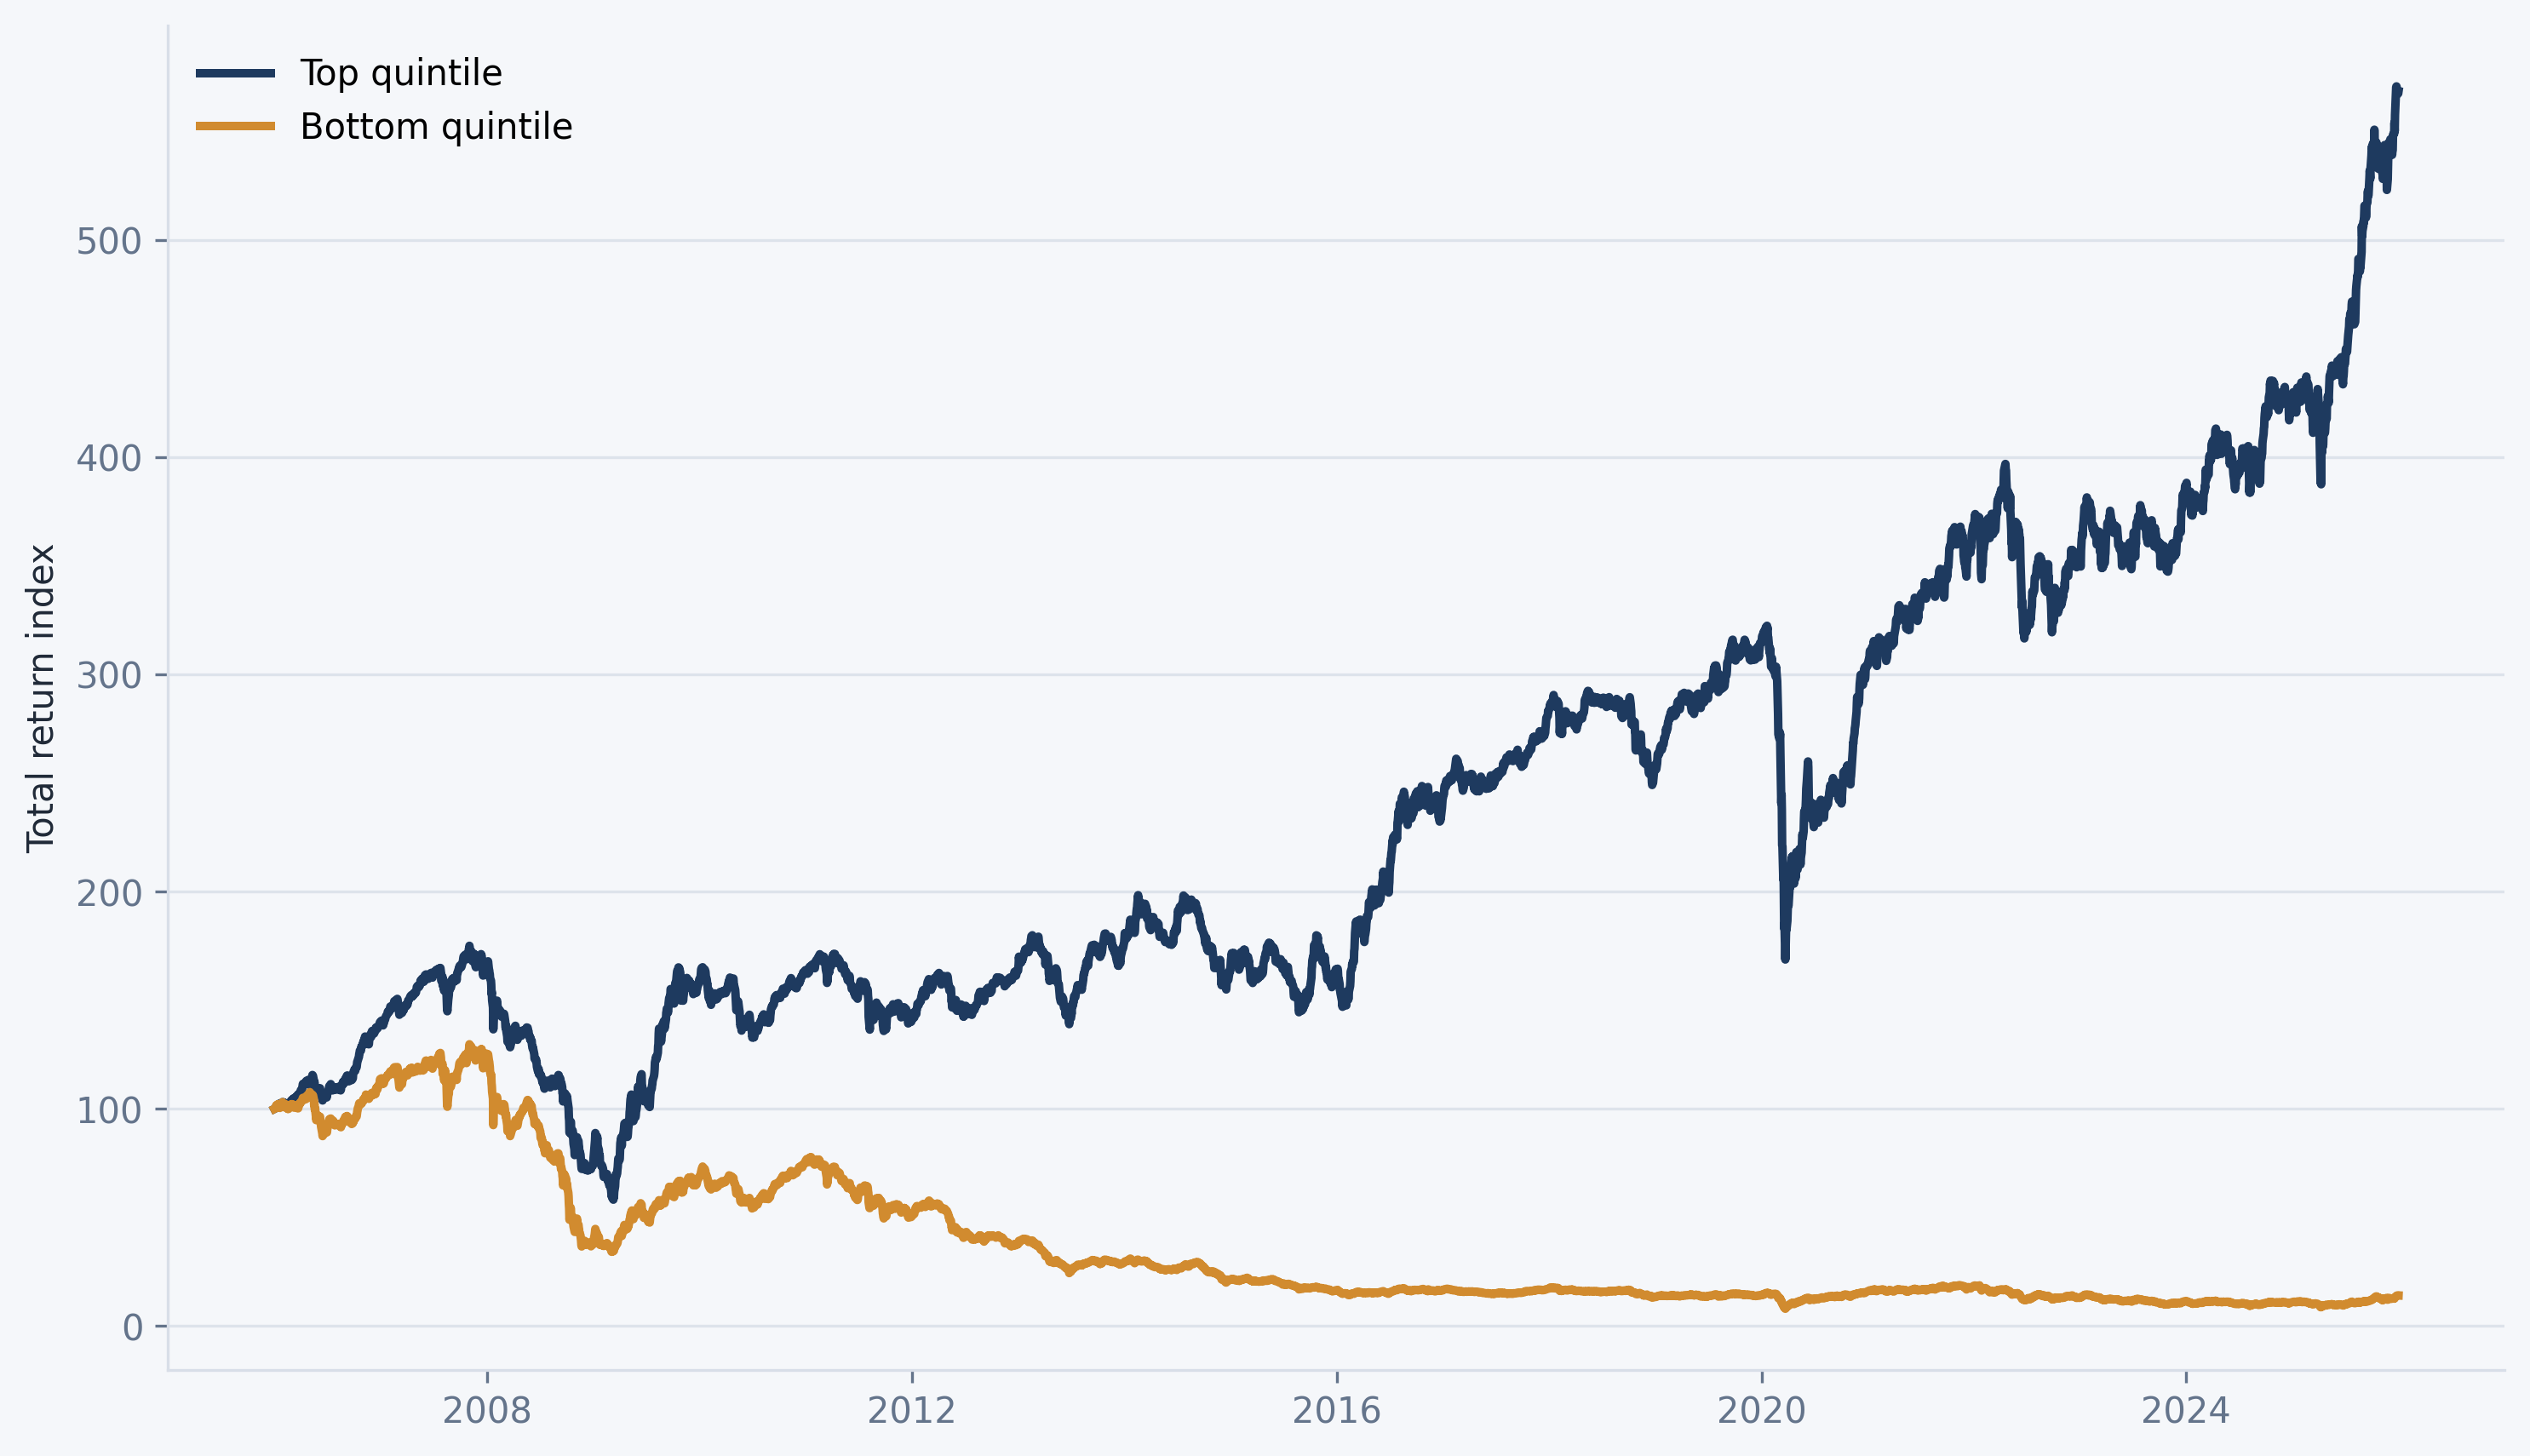
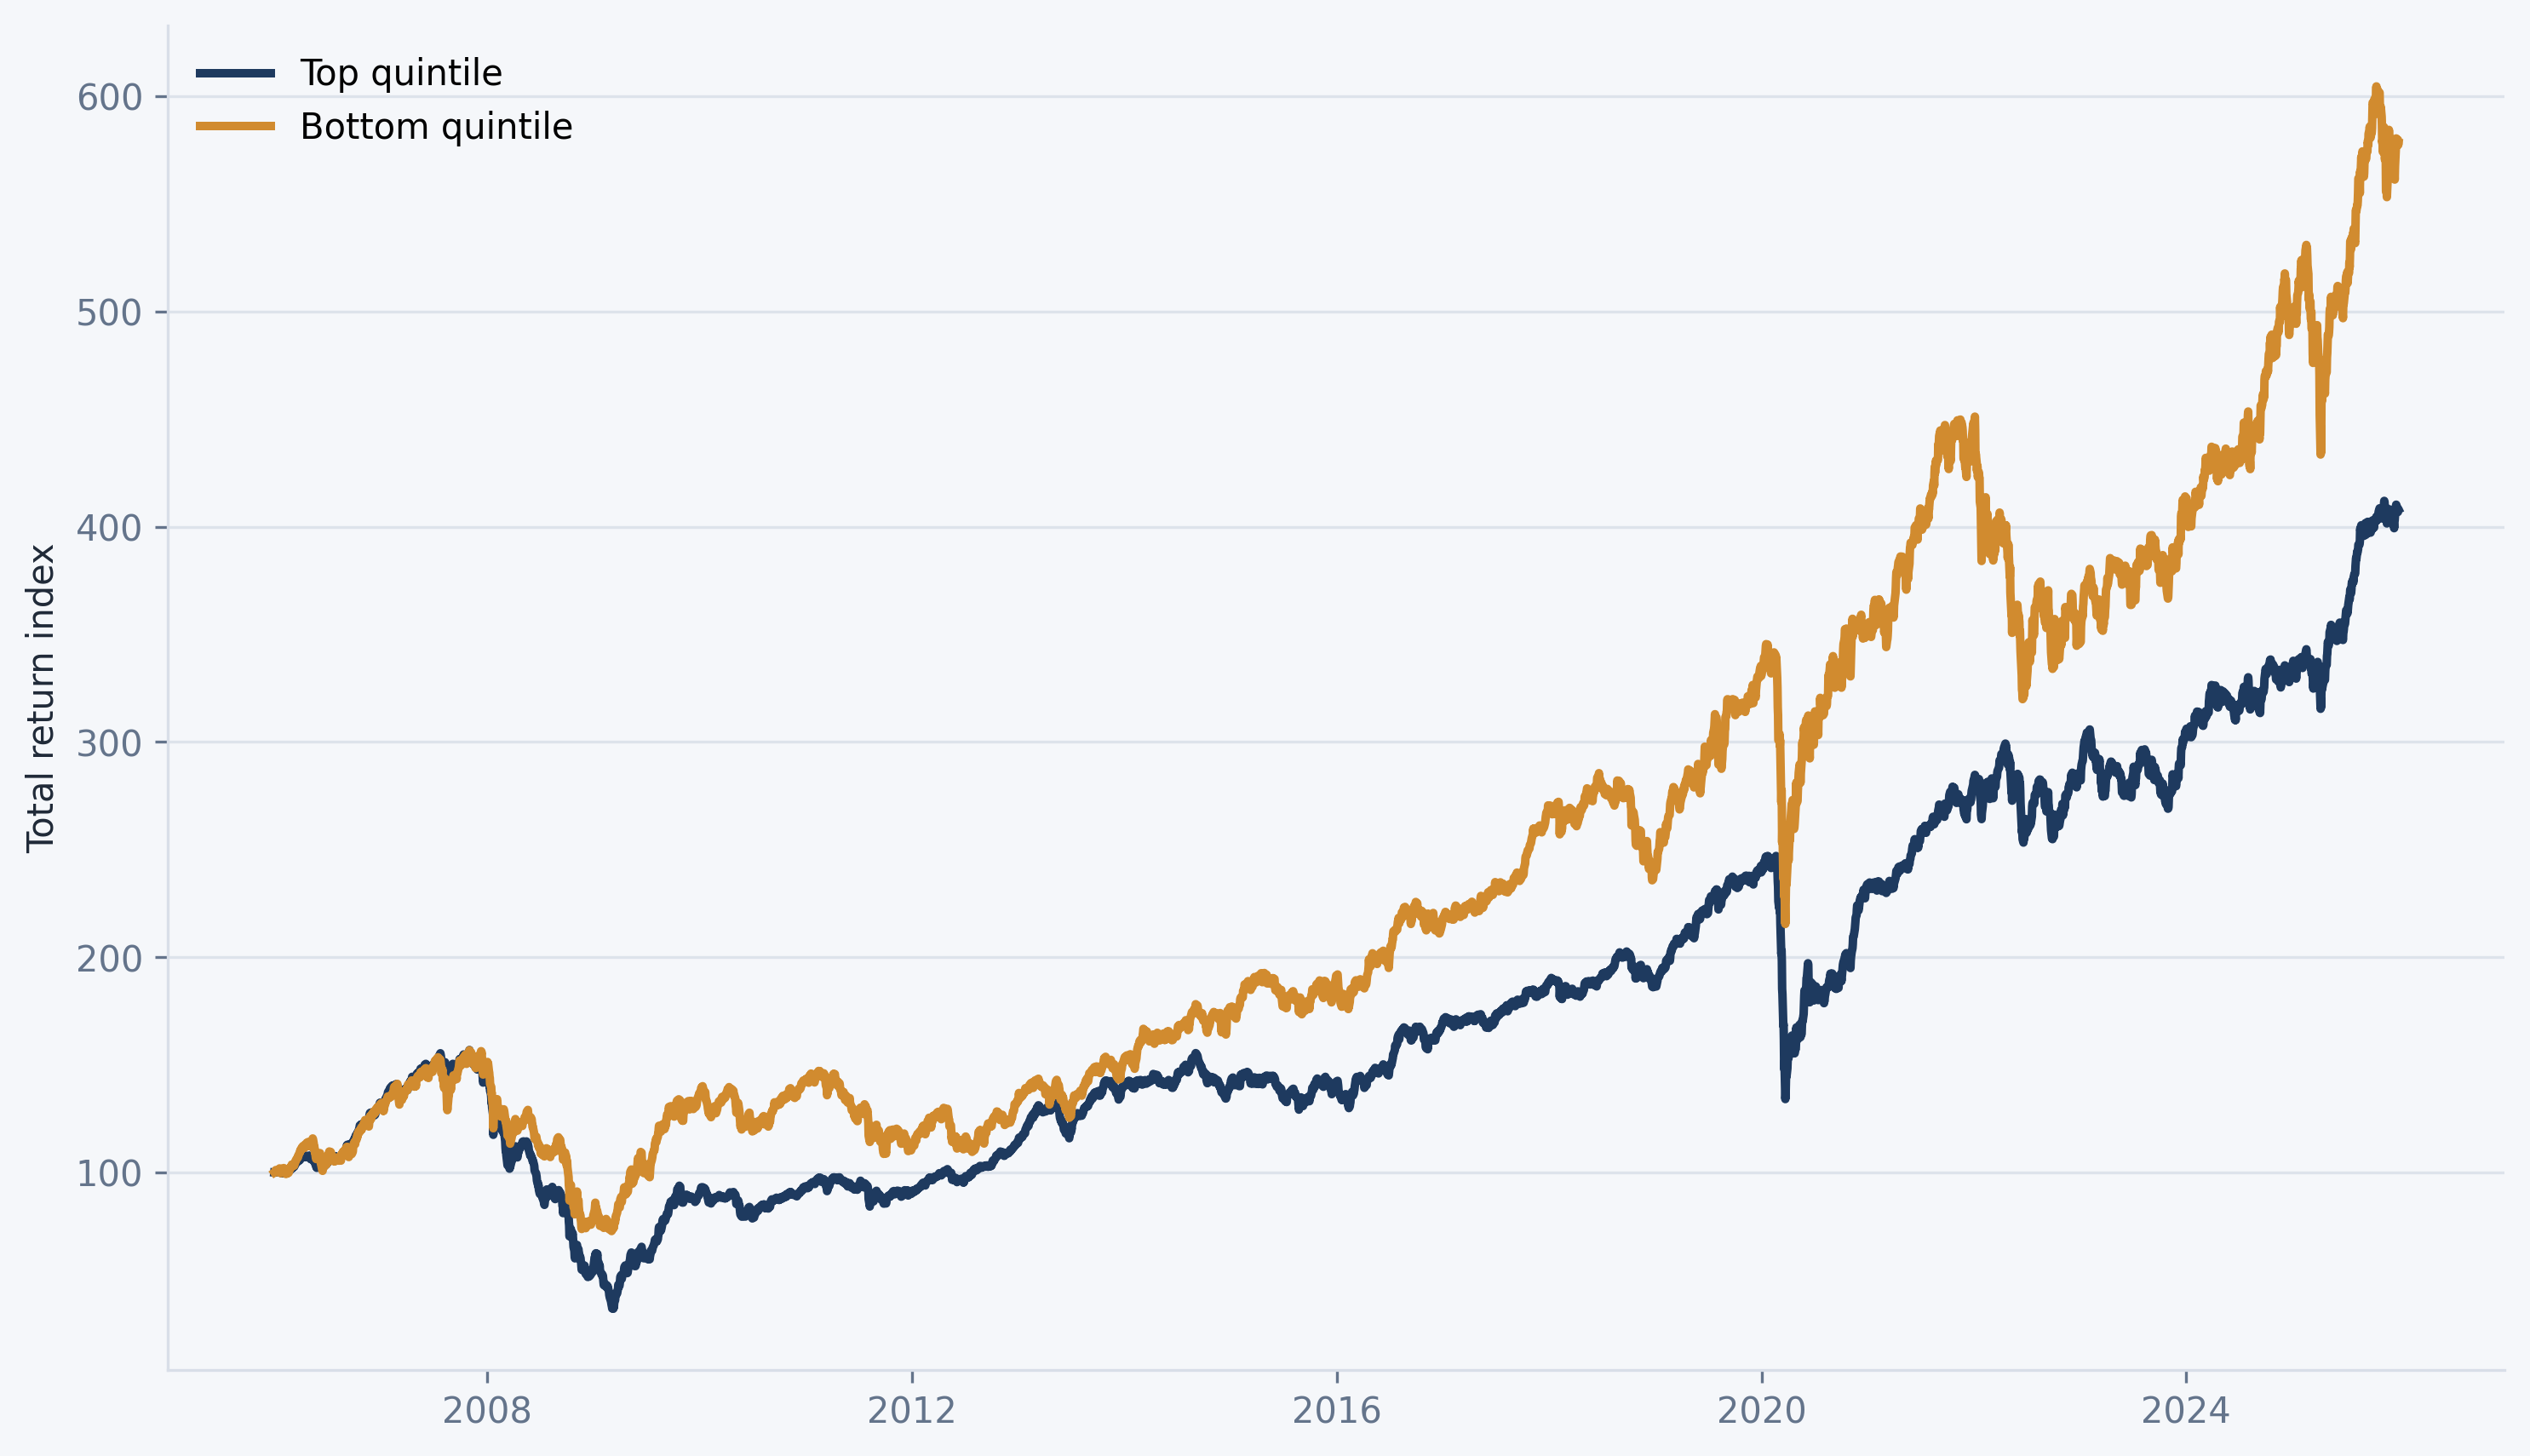
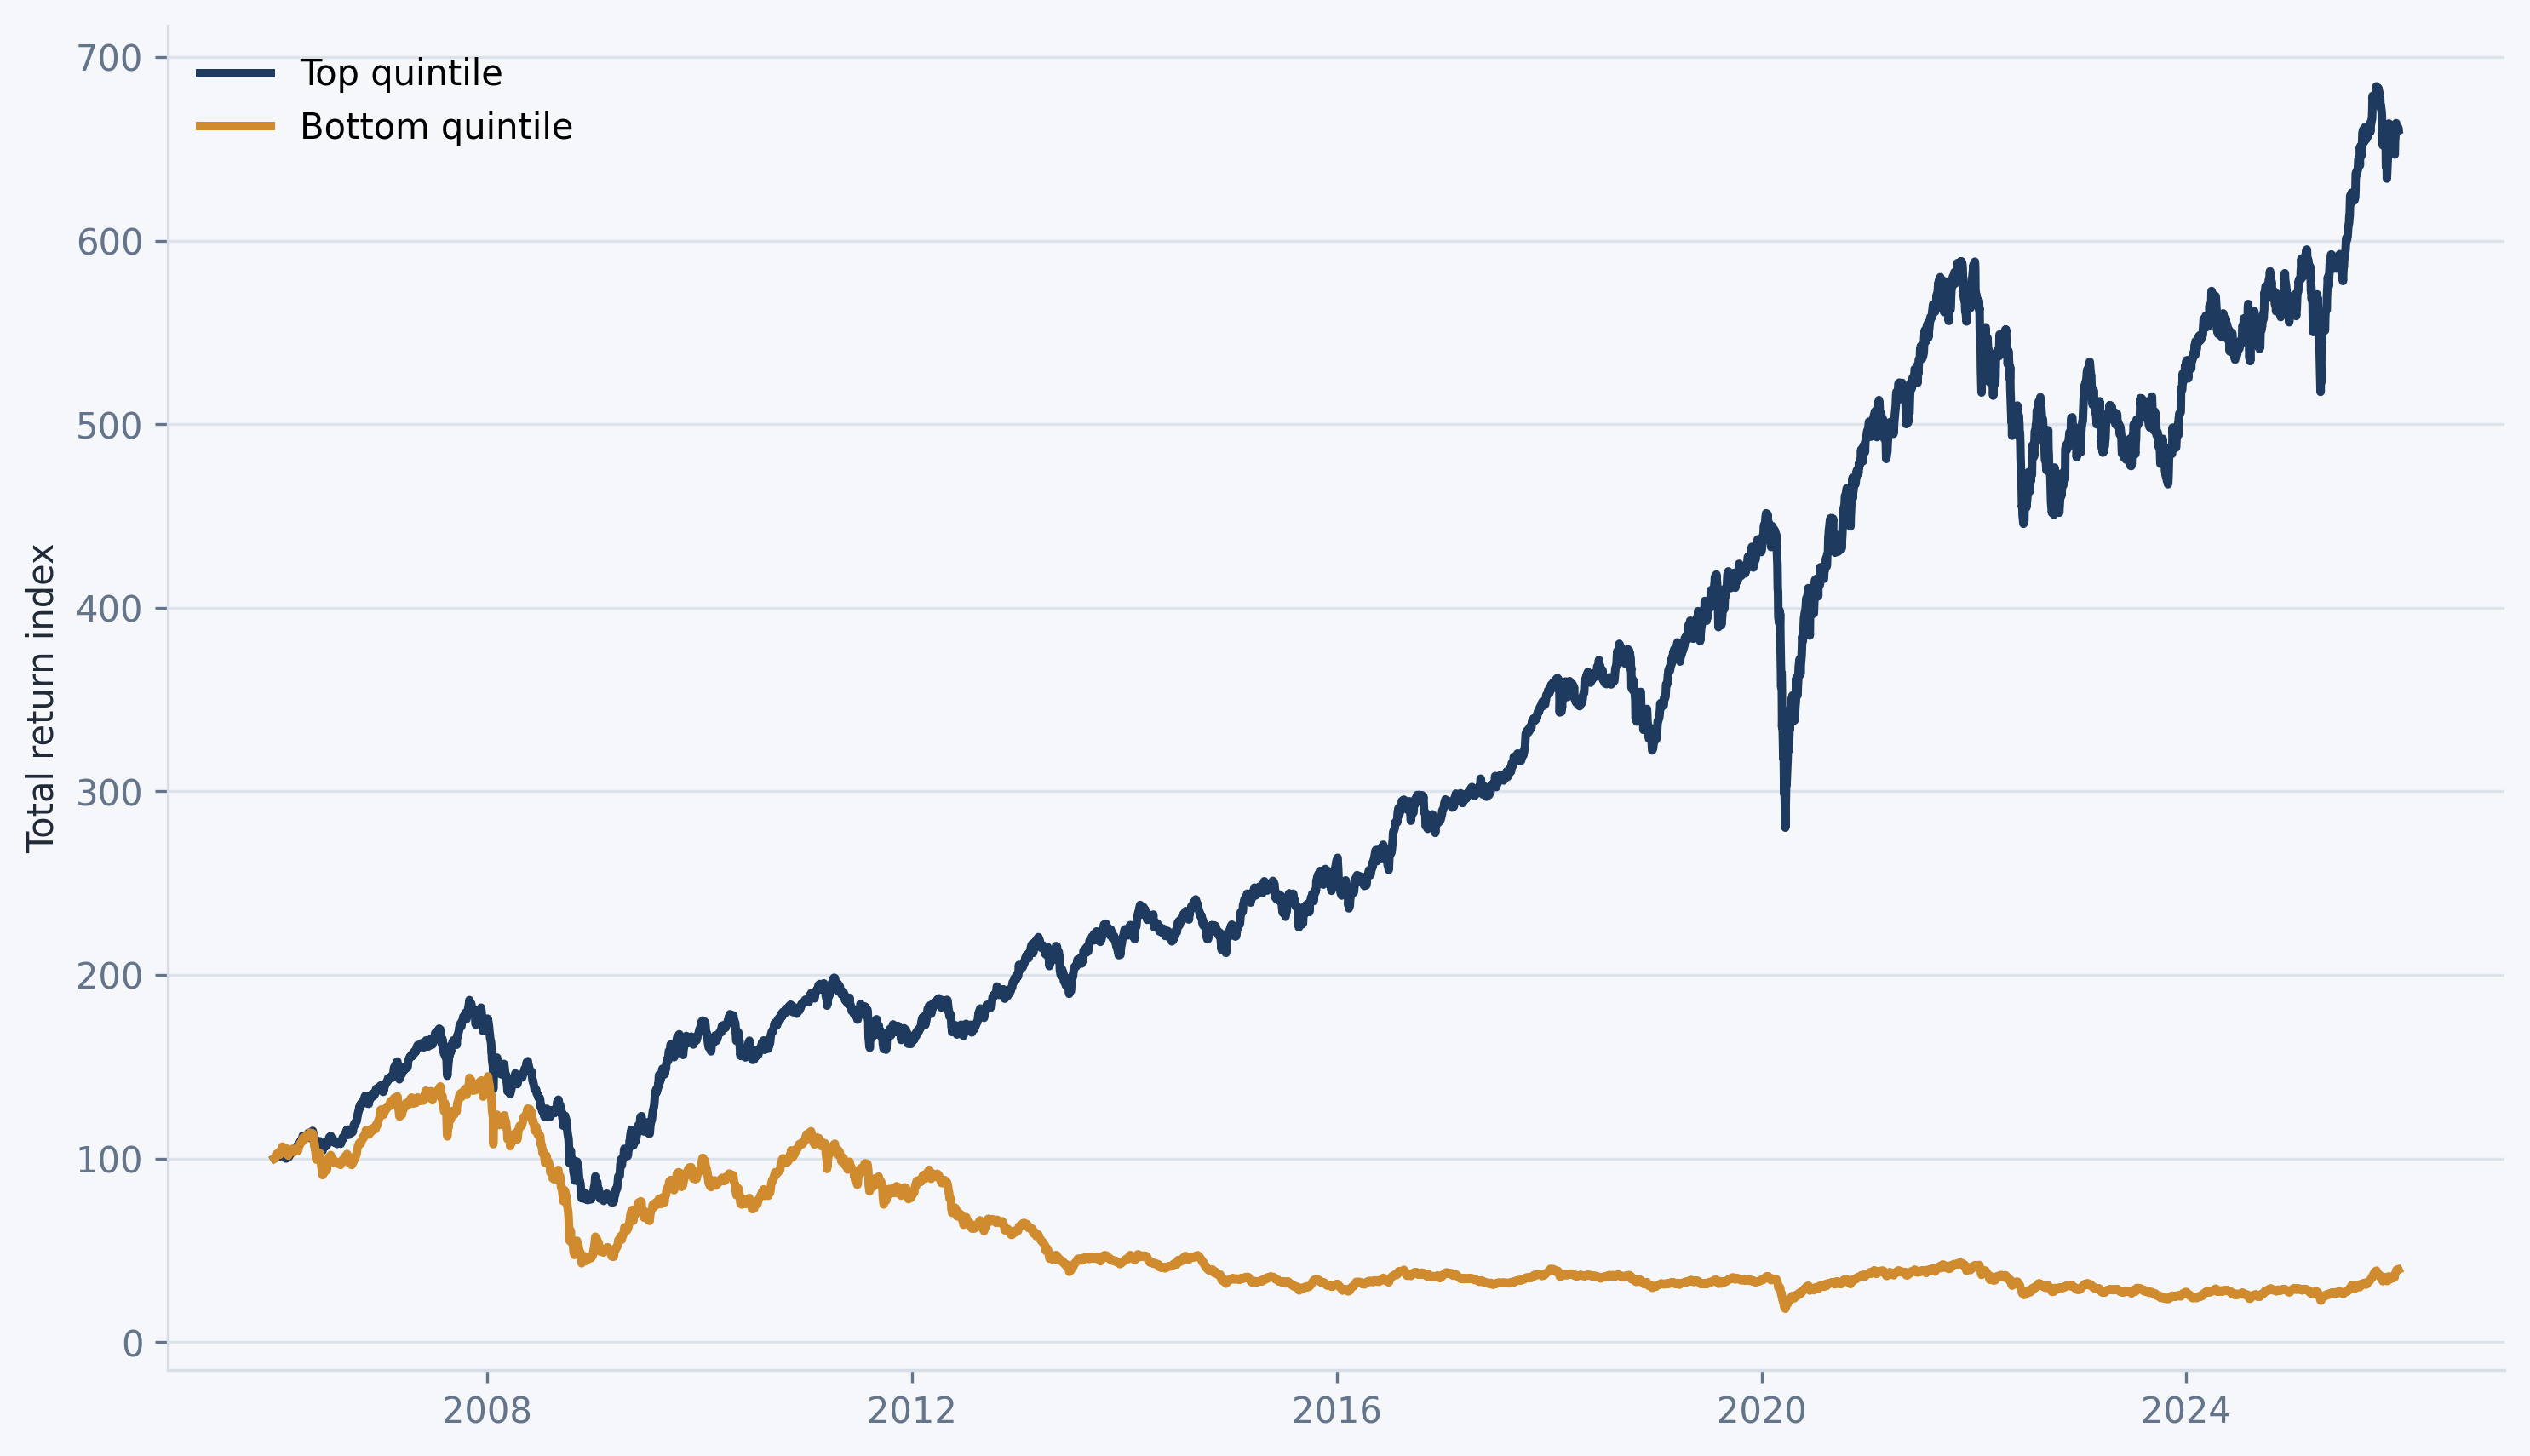
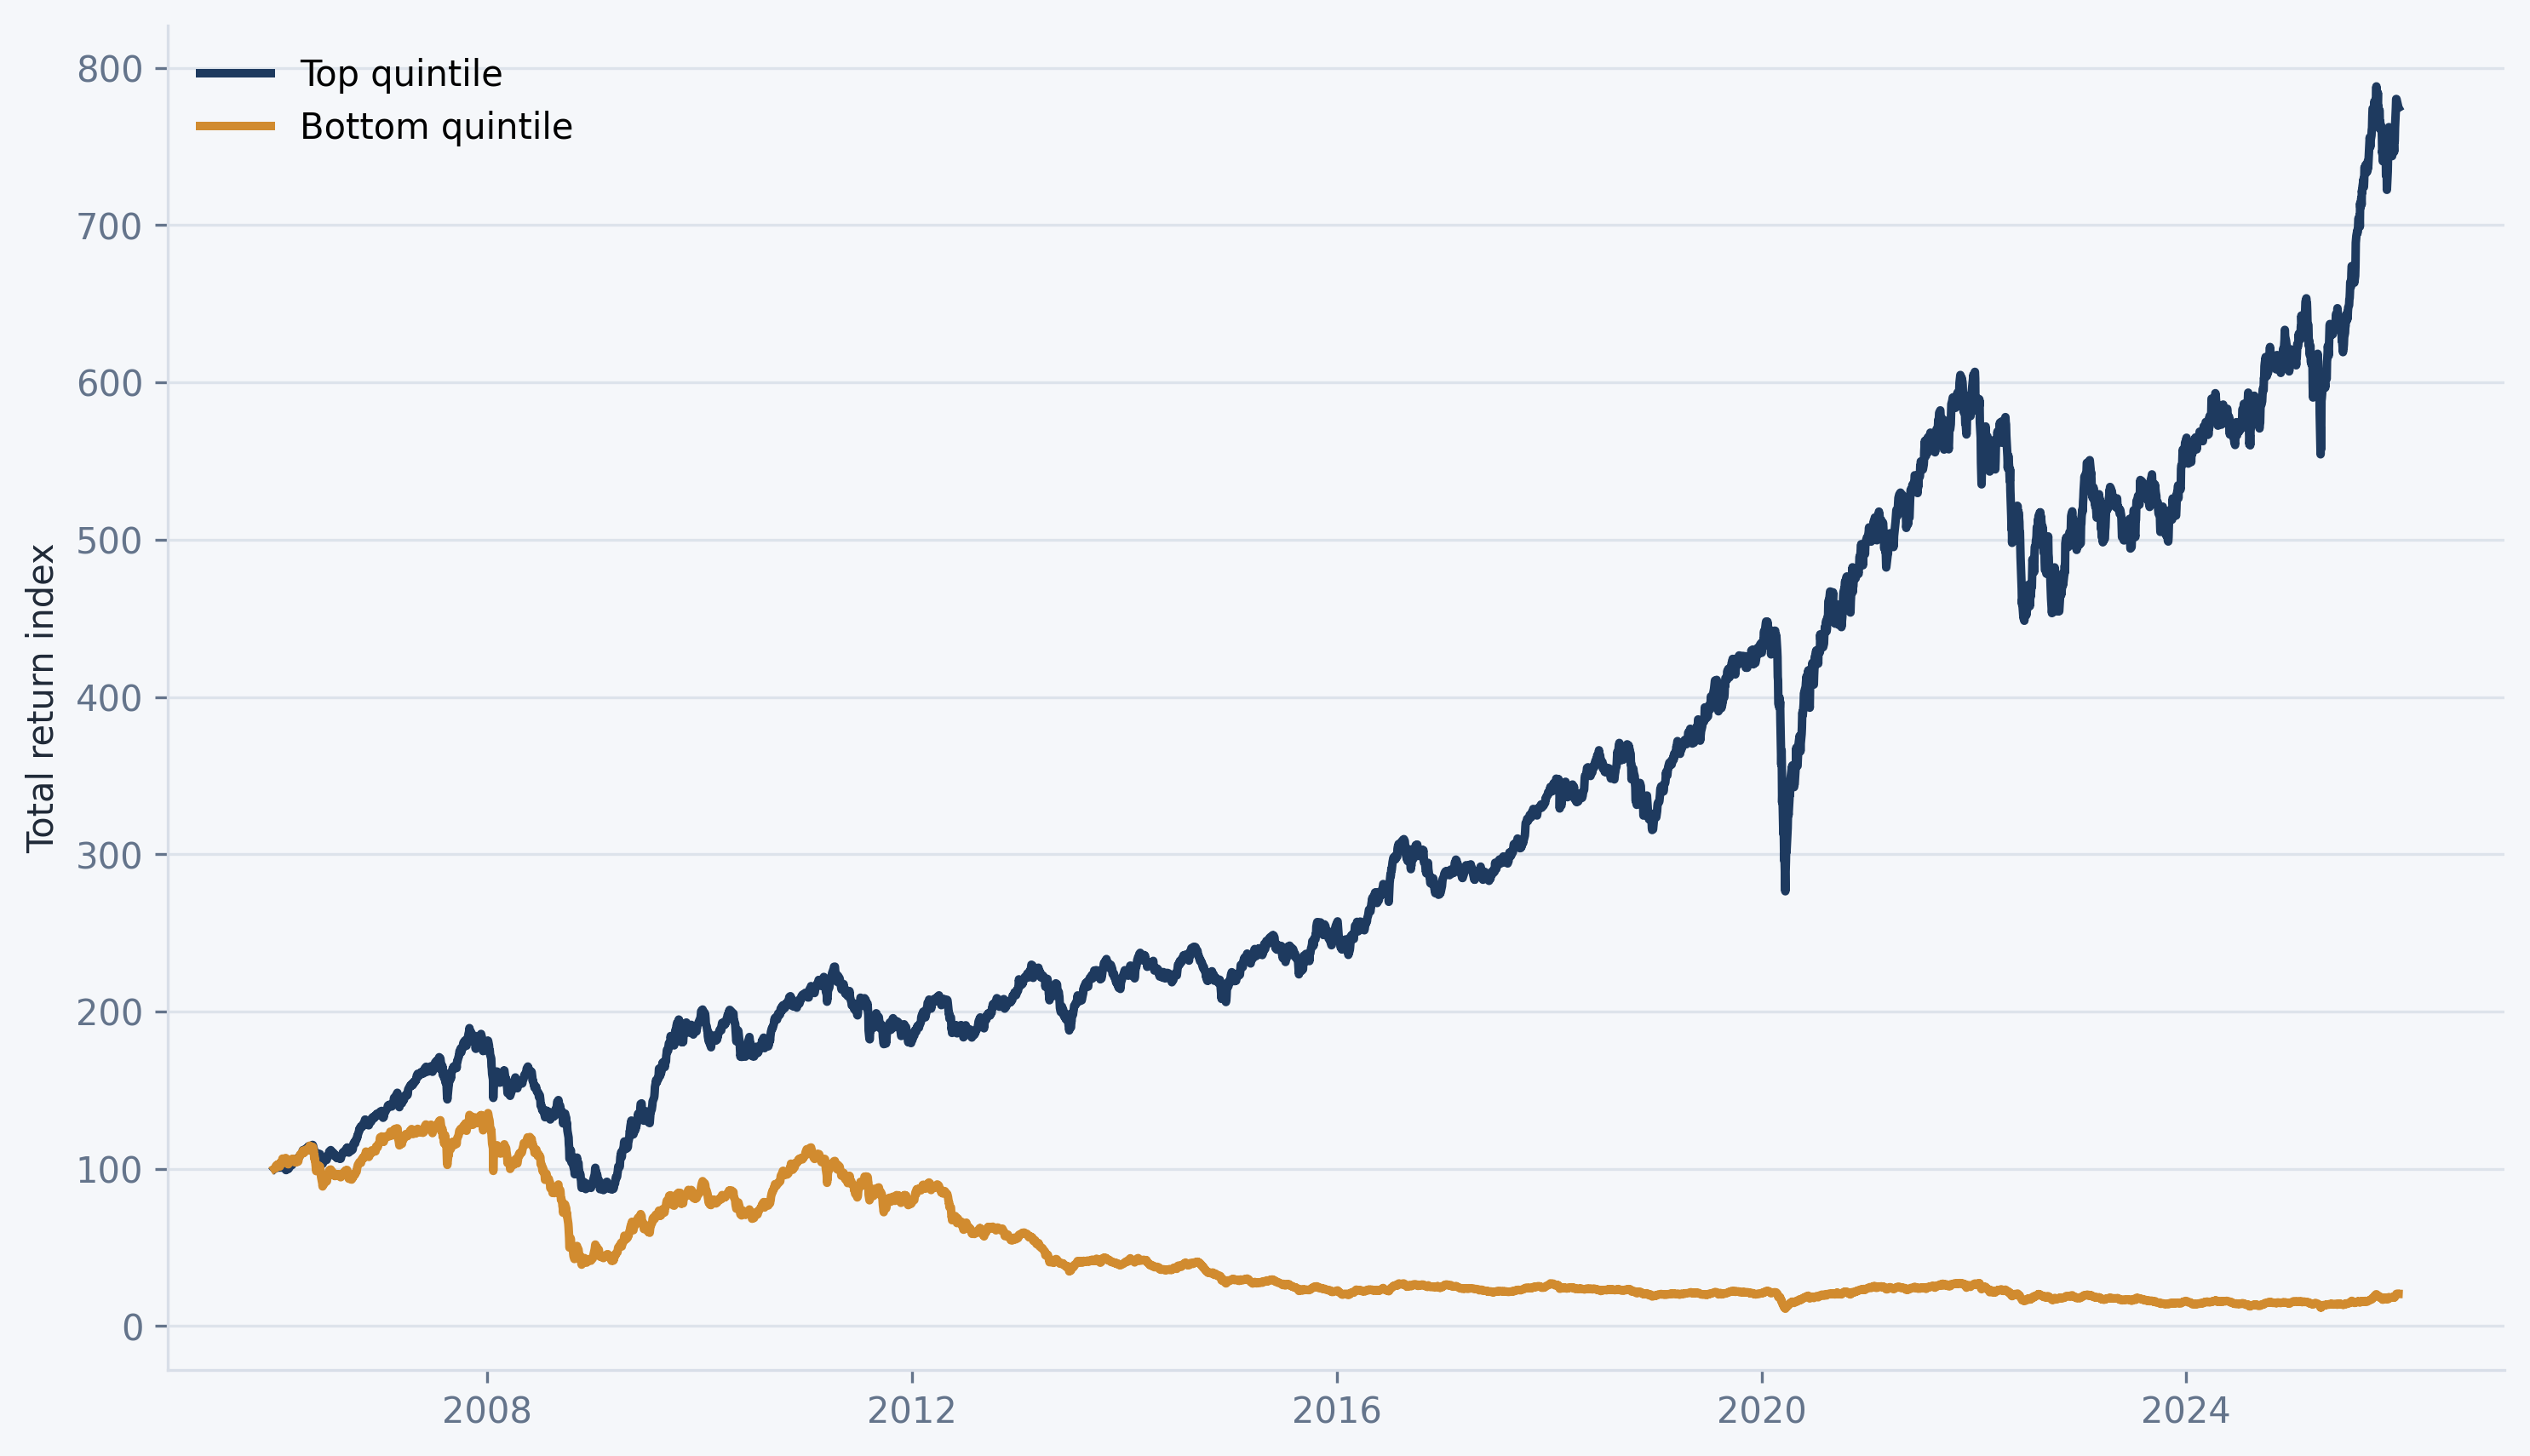
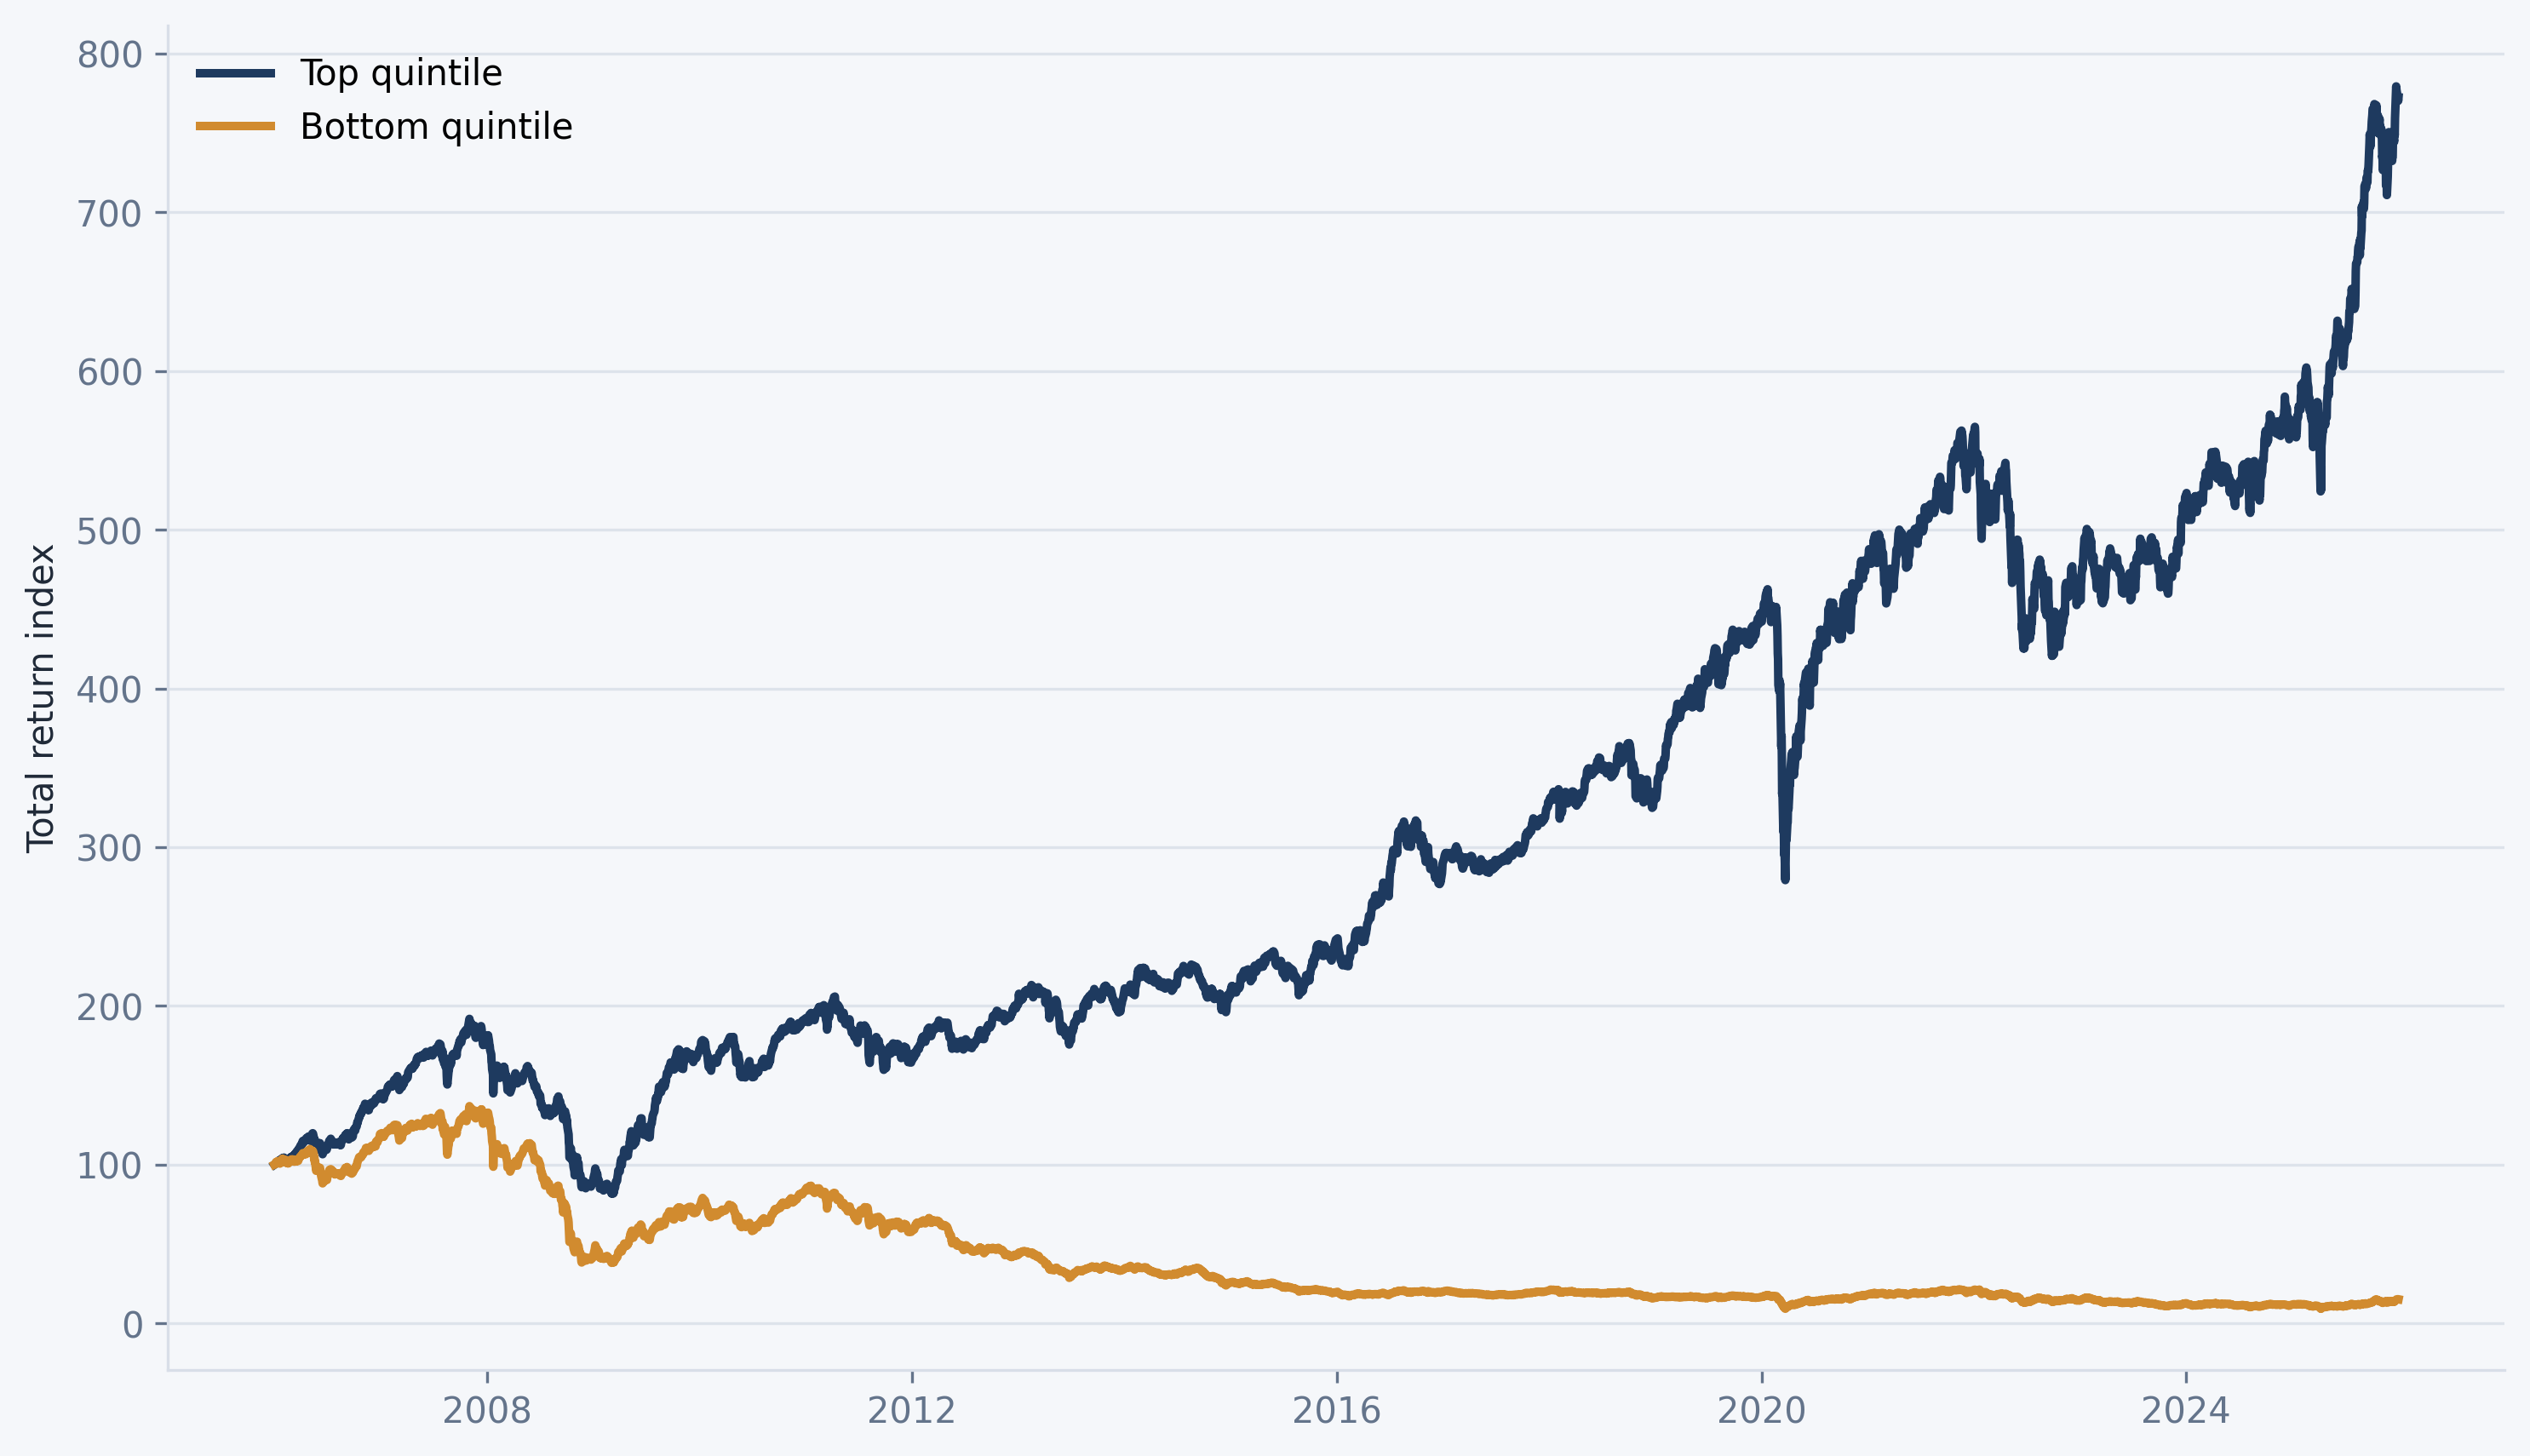
Here we present more details on the return characteristics of the factor mimicking portfolios designed to capture the influence of various firm attributes related to value/growth orientation and profitability. The portfolios are formed every December by sorting the universe of All Ordinaries Index stocks into terciles based on the attribute of interest. The factor mimicking portfolio returns are the monthly return spread between the top tercile portfolio and the bottom tercile portfolio. Relative volatility is the ratio of the factor mimicking portfolio volatility to the volatility of the return spread of randomly assigned tercile portfolios.
| Factor | Minimum | 25th percentile | 75th percentile | Maximum | Standard deviation | Relative volatility |
|---|---|---|---|---|---|---|
| Book to market | -0.146 | -0.023 | 0.023 | 0.146 | 0.043 | 2.431 |
| Earnings to price | -0.110 | -0.016 | 0.034 | 0.155 | 0.040 | 2.076 |
| Operating cashflow / Market cap | -0.103 | -0.010 | 0.040 | 0.131 | 0.037 | 1.974 |
| Dividend yield | -0.200 | -0.015 | 0.019 | 0.072 | 0.031 | 1.548 |
| Return on equity | -0.106 | -0.018 | 0.038 | 0.131 | 0.041 | 2.427 |
| Return on assets | -0.097 | -0.011 | 0.041 | 0.129 | 0.041 | 1.919 |
| Operating cashflow / Assets | -0.092 | -0.005 | 0.037 | 0.105 | 0.035 | 1.840 |
Factor mimicking portfolio total return indices