Equities Risk
Factor-industry correlations (raw returns)
Diagnostics to identify the extent of any overlap between raw factor returns and raw industry returns.
Synopsis
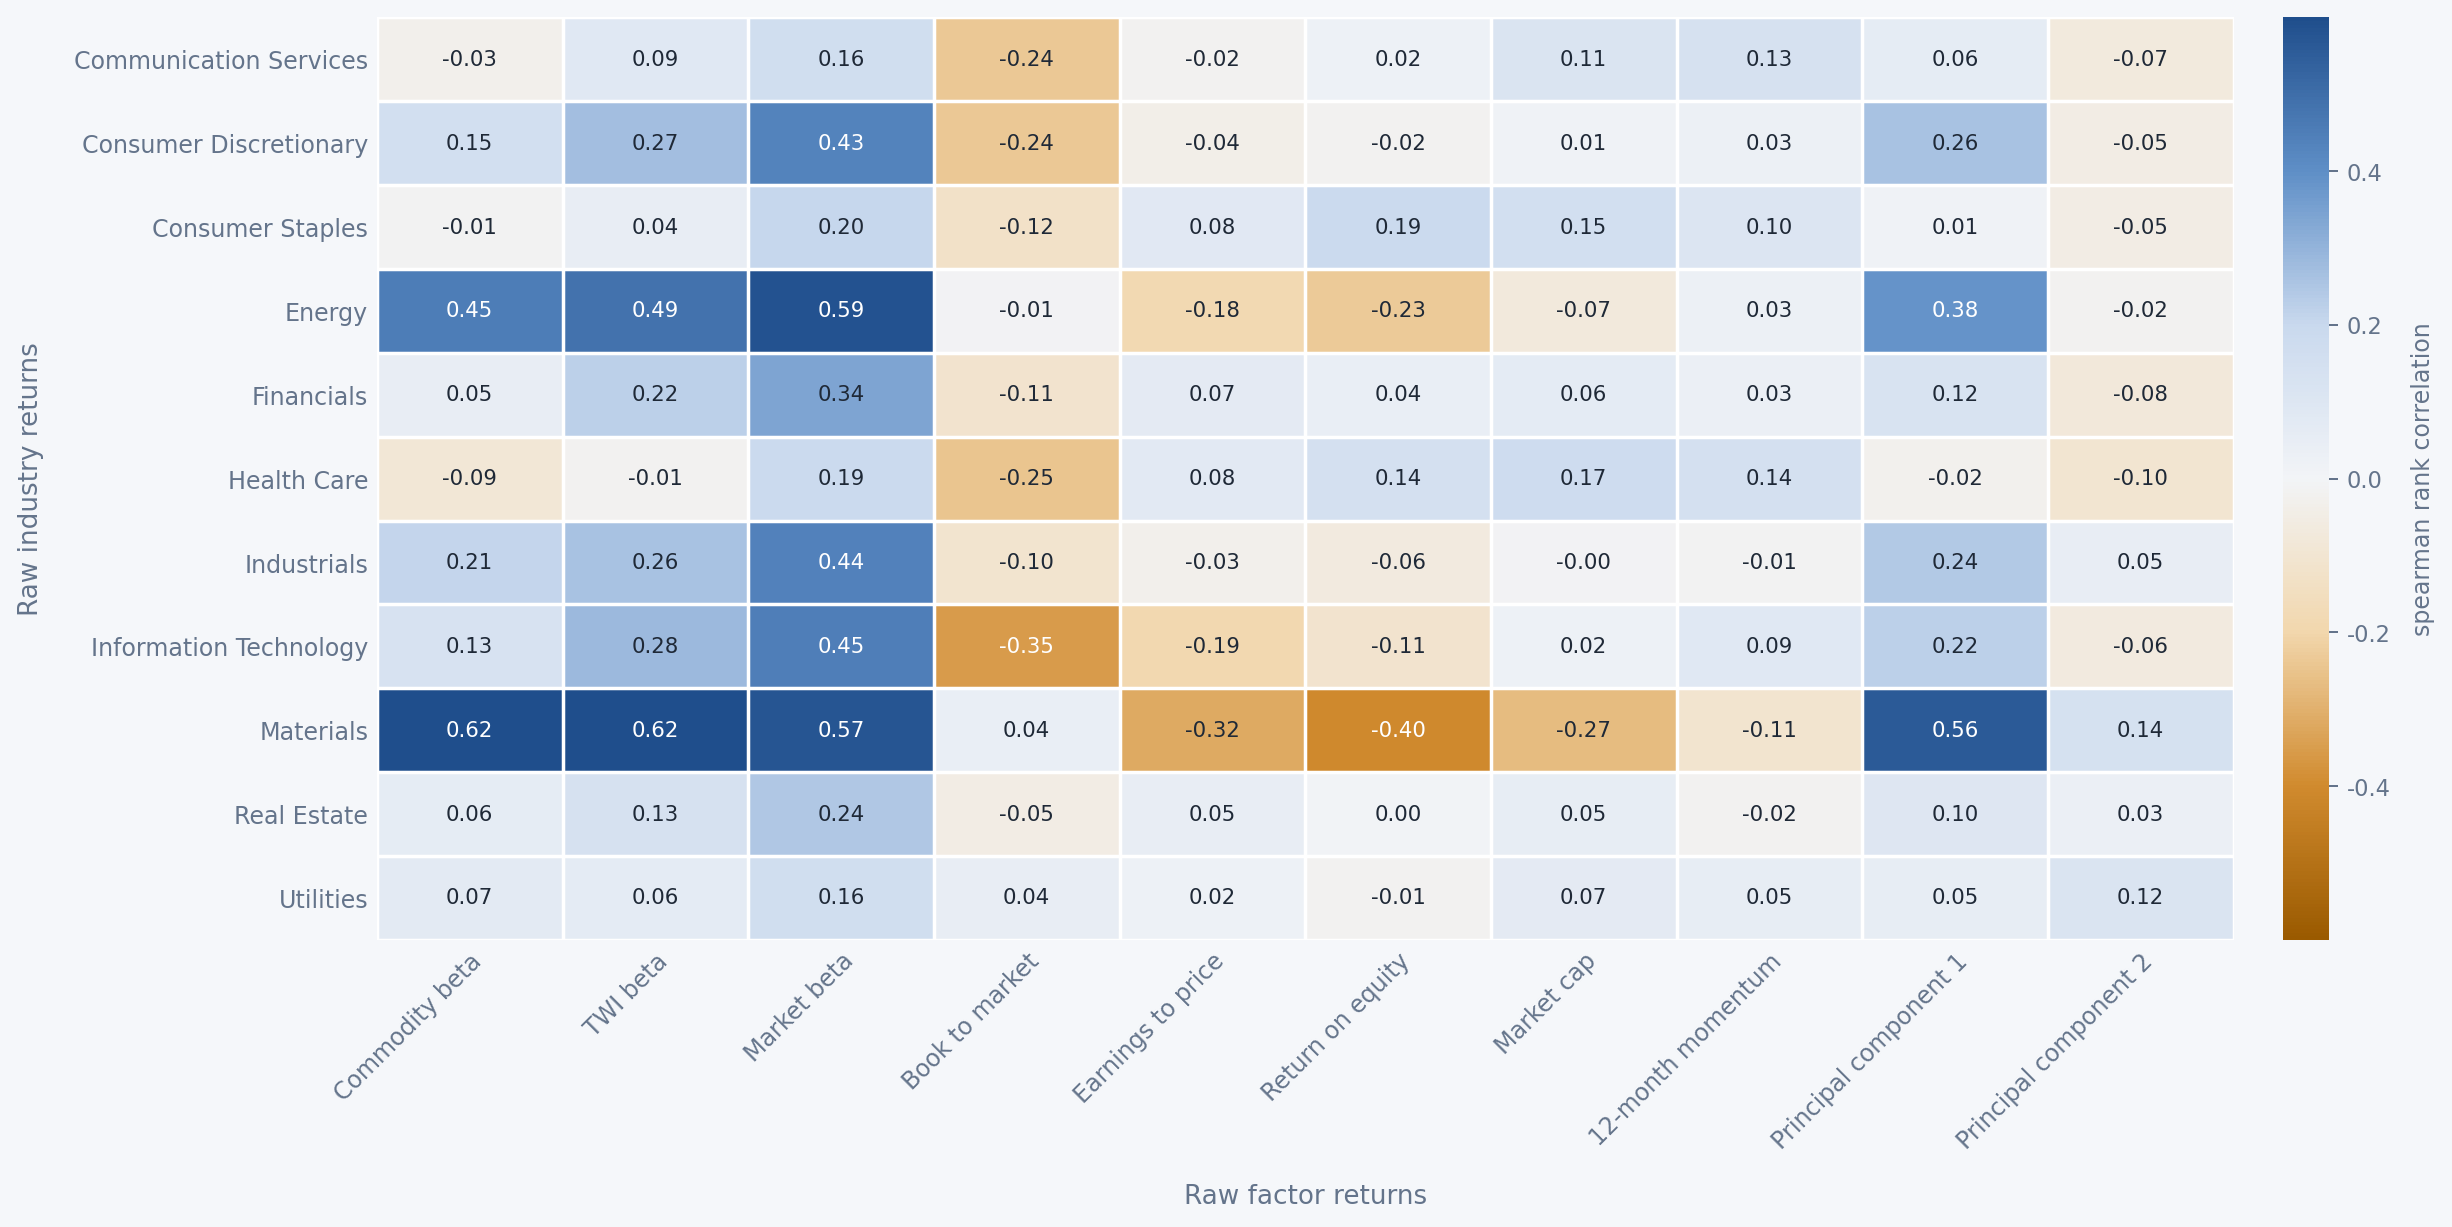
Here we present the rank-correlations of the raw returns of industries with the raw returns of factor mimicking portfolios (FMPs) for the shortlisted subset of observable factors. The purpose is to determine the extent to which factor loadings are proxying for industry exposure. High absolute correlations suggest overlapping exposures, while low correlations suggest more distinct sources of risk.
The section is best studied in conjunction with the next section dealing with the correlations between market-purged returns of factors and those of industries.
Interpretation
The raw-return correlations show clear common variation between several factors and industry returns. Market beta is positively correlated with most industries, with particularly strong relationships for Energy, Materials, Information Technology and Industrials. Commodity and TWI betas also display pronounced positive correlations with the resource-oriented Energy and Materials sectors, while Materials exhibits sizeable negative correlations with earnings-to-price, return on equity and market capitalisation. Book-to-market is generally negatively related to growth-oriented sectors, most notably Information Technology, while momentum and the second principal component show comparatively weak industry relationships. The relatively broad correlations observed for some factors, particularly market beta and the first principal component, may partly reflect their shared exposure to aggregate market movements rather than purely industry-specific relationships.