Equities Risk
Factor Return Correlations by Category
Correlation diagnostics for factor-mimicking portfolio returns, used to identify overlap among economic, style and statistical factors.
Synopsis
Here we present rank-correlation heatmaps of the factor mimicking portfolio (FMP) returns, to determine the extent to which apparently distinct factors are capturing similar return variation. High absolute correlations suggest overlapping exposures, while low correlations suggest more distinct sources of risk.
To avoid clutter given the large number of factors, we show FMP correlations within each category. Subsequent sections show FMP correlations within the shortlisted subset of observable factors, selected for their ability to capture systematic return variation, and between the statistical and shortlisted observable factors.
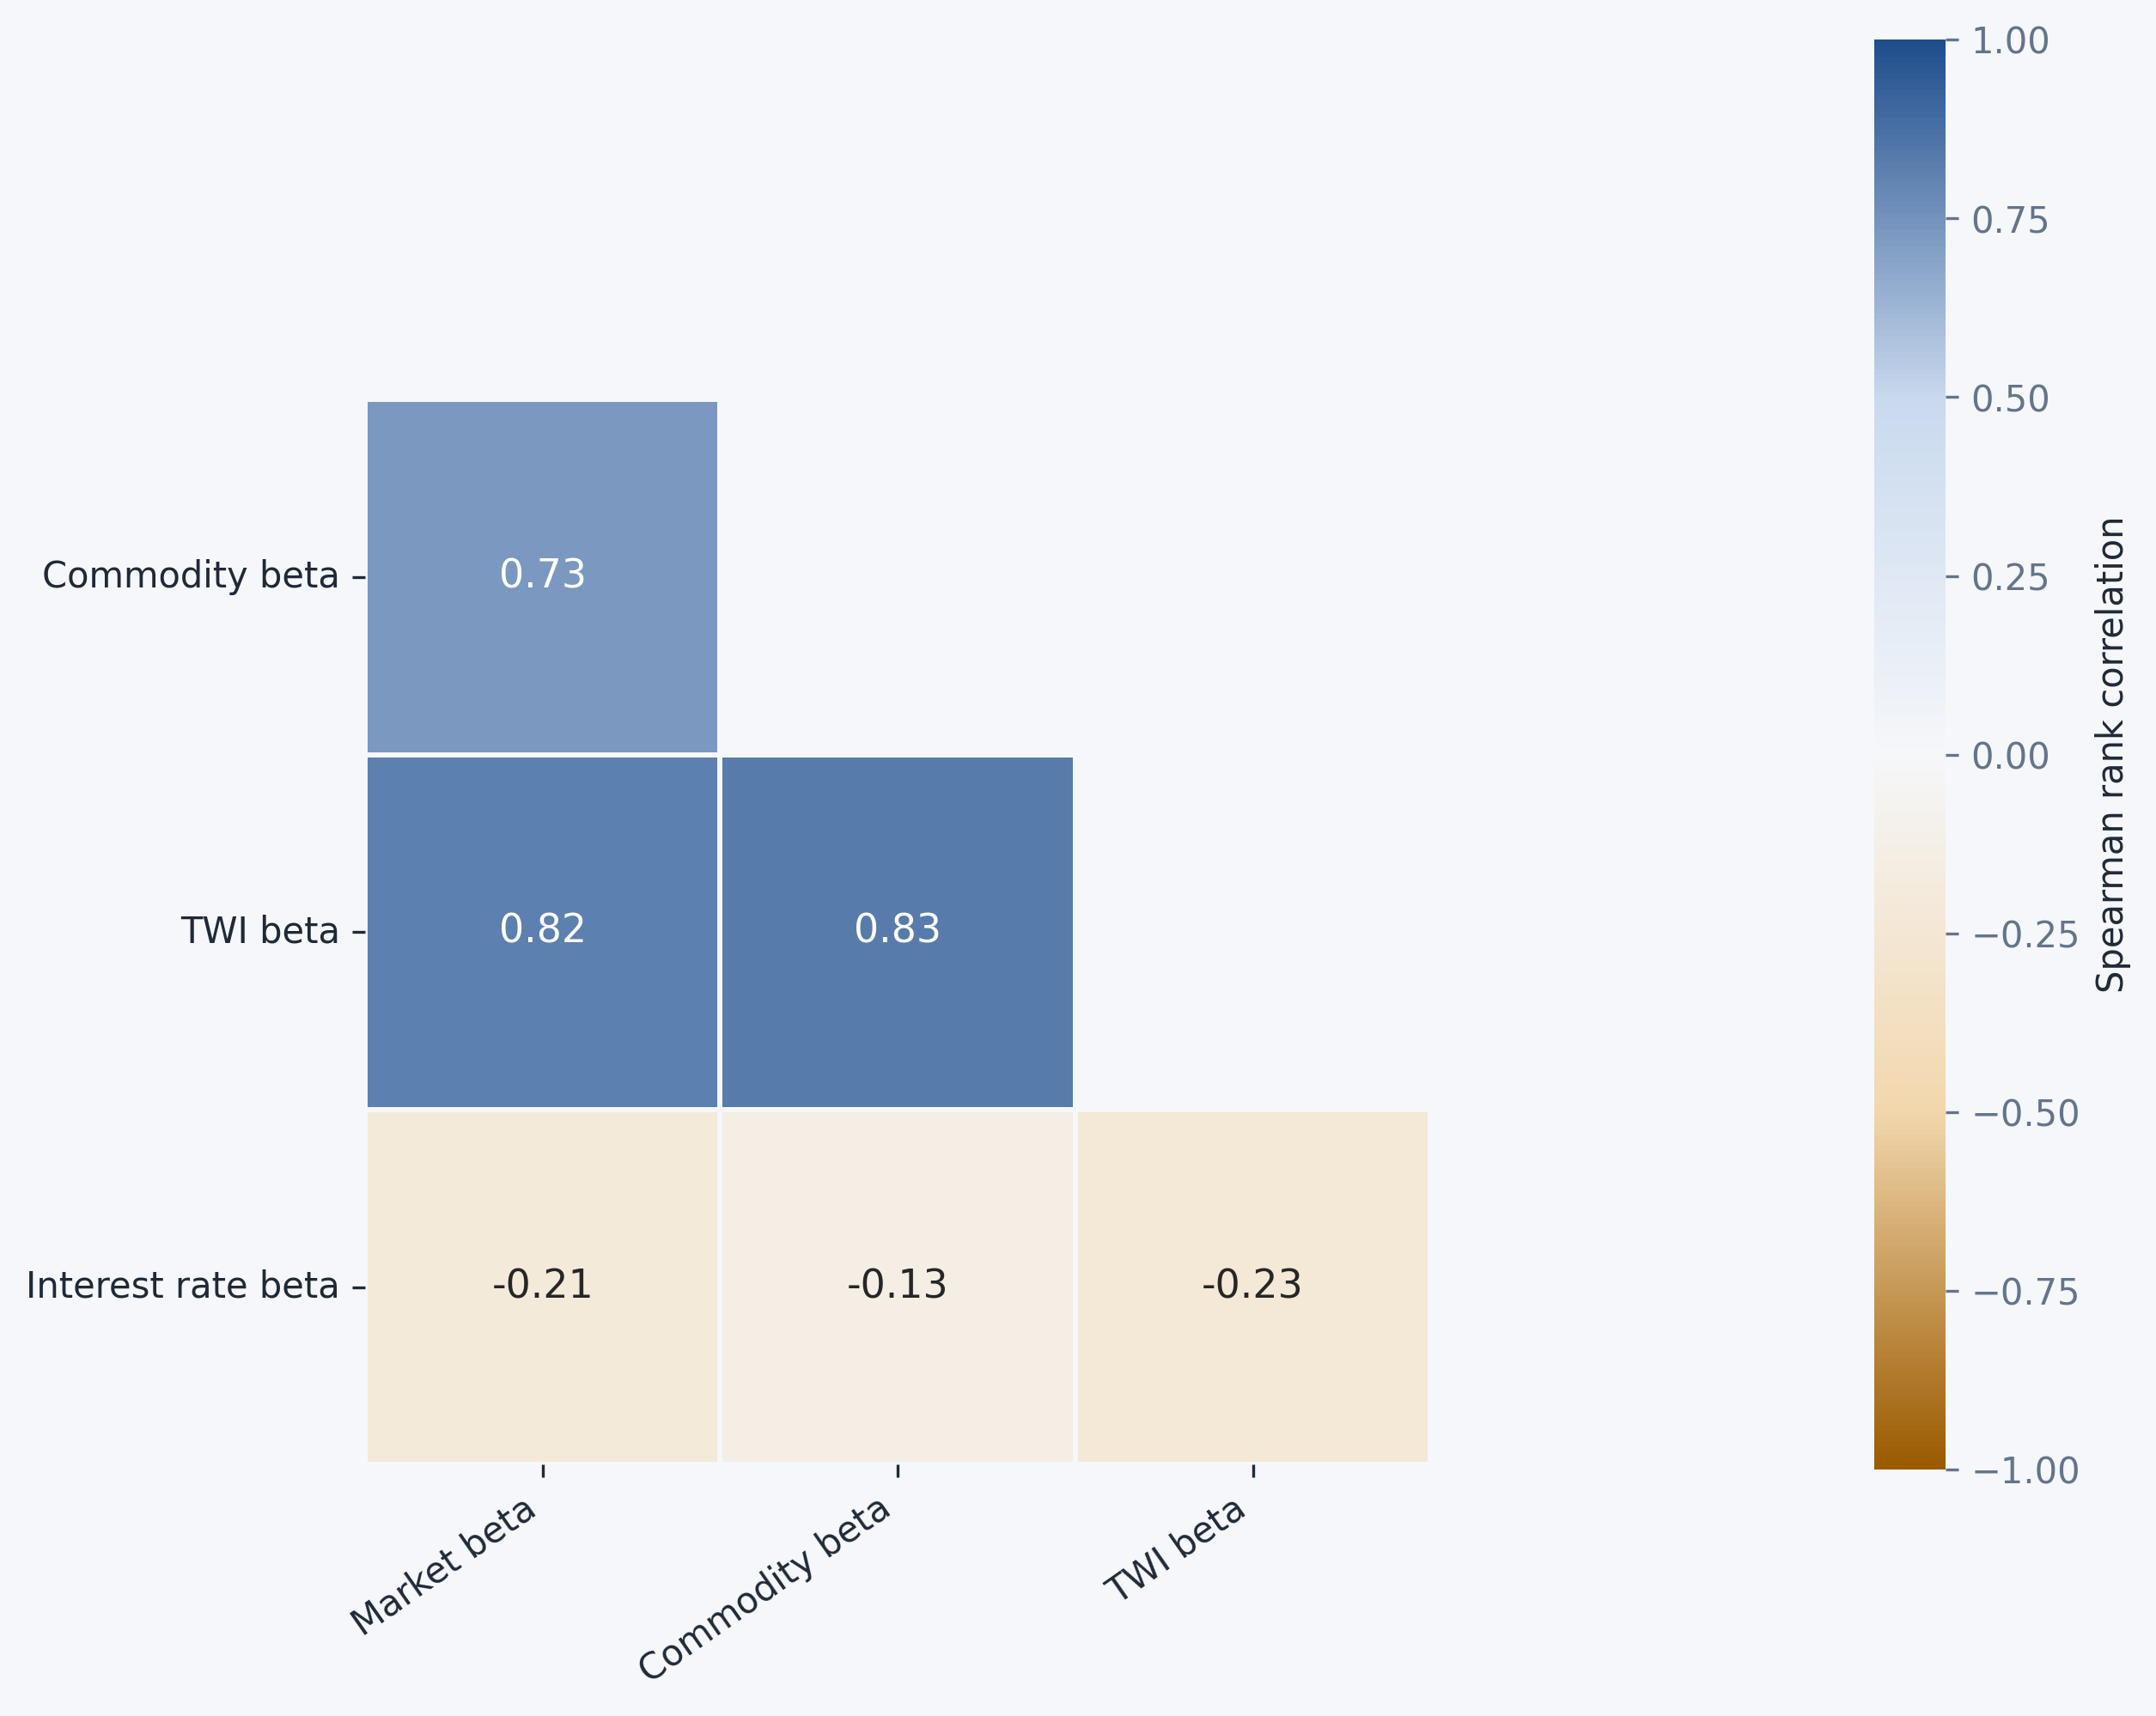
The economic factors reveal a pronounced degree of redundancy among the three shortlisted exposures: market, commodity and TWI betas are all strongly positively correlated, with pairwise correlations between 0.73 and 0.83. By contrast, interest-rate beta is only weakly negatively related to the other three, suggesting that it captures a substantially different dimension of economic exposure. This creates an interesting selection trade-off: the shortlisted factors appear individually meaningful, but collectively contain considerable overlapping information, whereas the excluded interest-rate beta offers greater distinctiveness even if its standalone empirical performance was insufficient to justify selection.
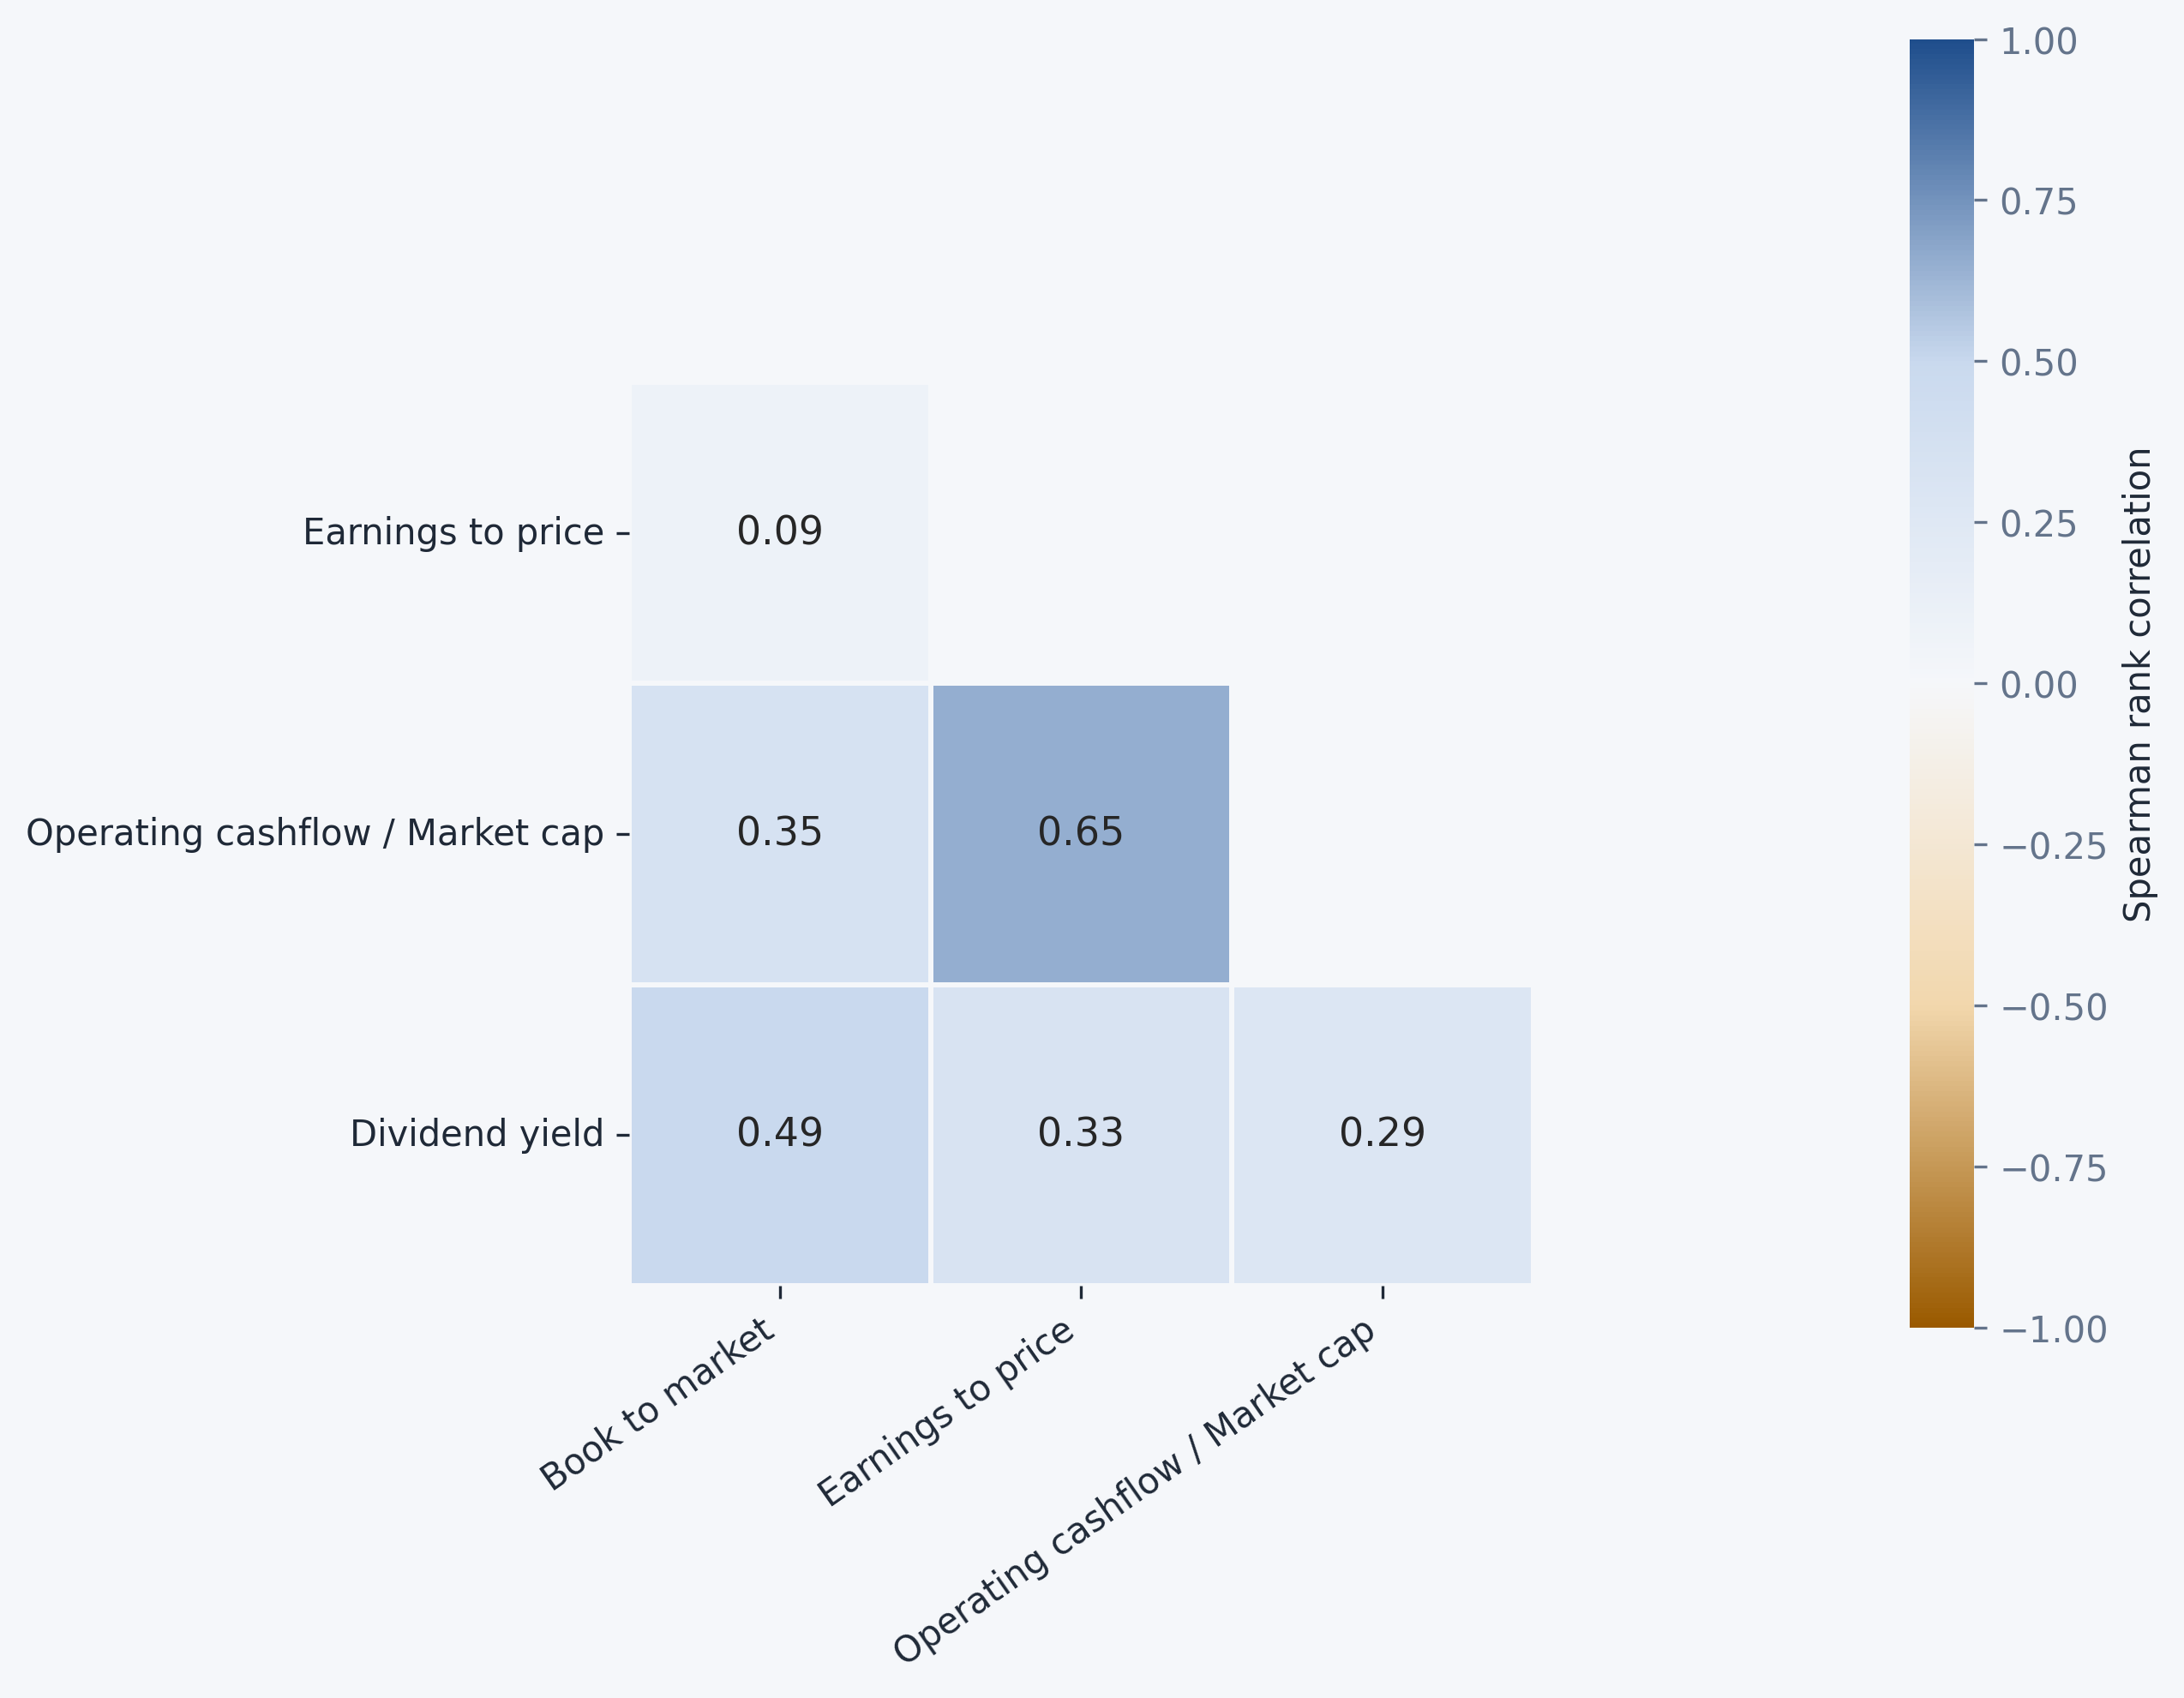
The value/growth factors are generally positively related, but the degree of overlap varies considerably. Earnings-to-price and operating cashflow-to-market-cap show the strongest association (0.65). Dividend yield is moderately correlated with book-to-market (0.49) but less strongly with earnings-to-price (0.33) and operating cashflow-to-market-cap (0.29). Most notably, book-to-market and earnings-to-price are almost uncorrelated (0.09), indicating that these two conventional value measures capture quite different cross-sectional information despite often being grouped under the same value/growth heading.
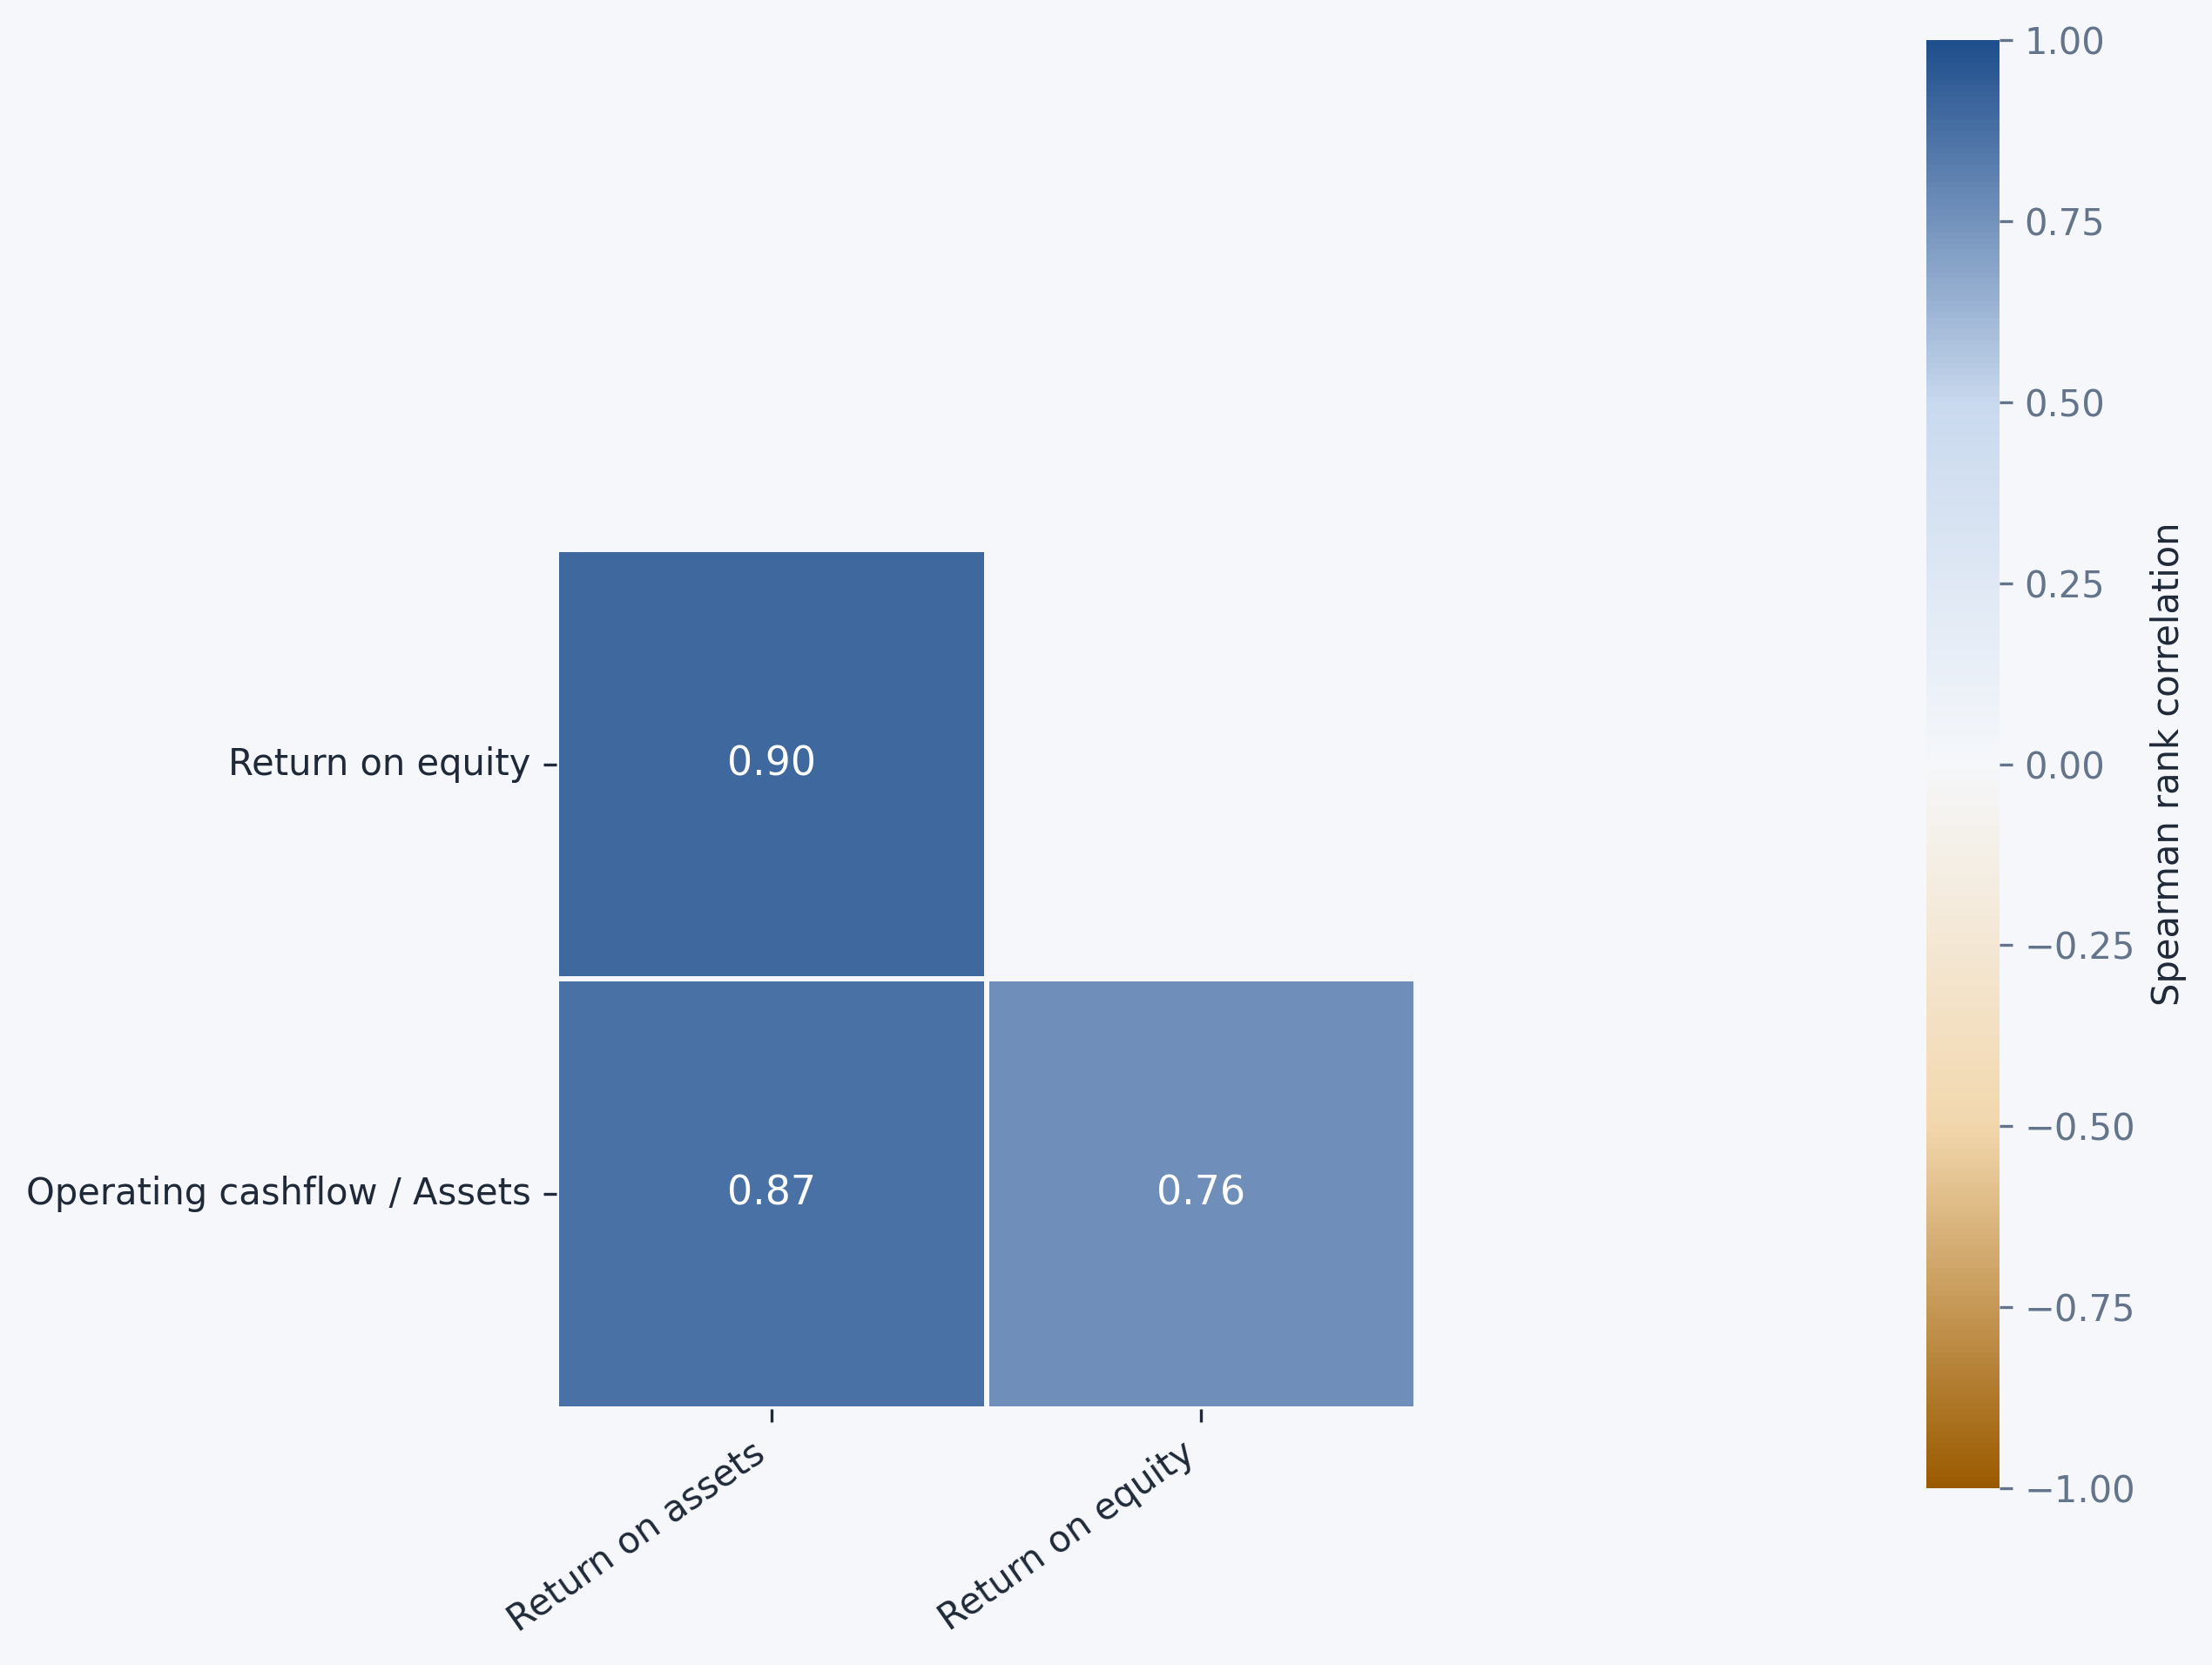
The profitability factor-mimicking portfolios are all highly correlated, with pairwise correlations ranging from 0.76 to 0.90. This is unsurprising given that return on assets, return on equity and operating cash flow relative to assets all capture closely related dimensions of underlying firm profitability and operating performance.
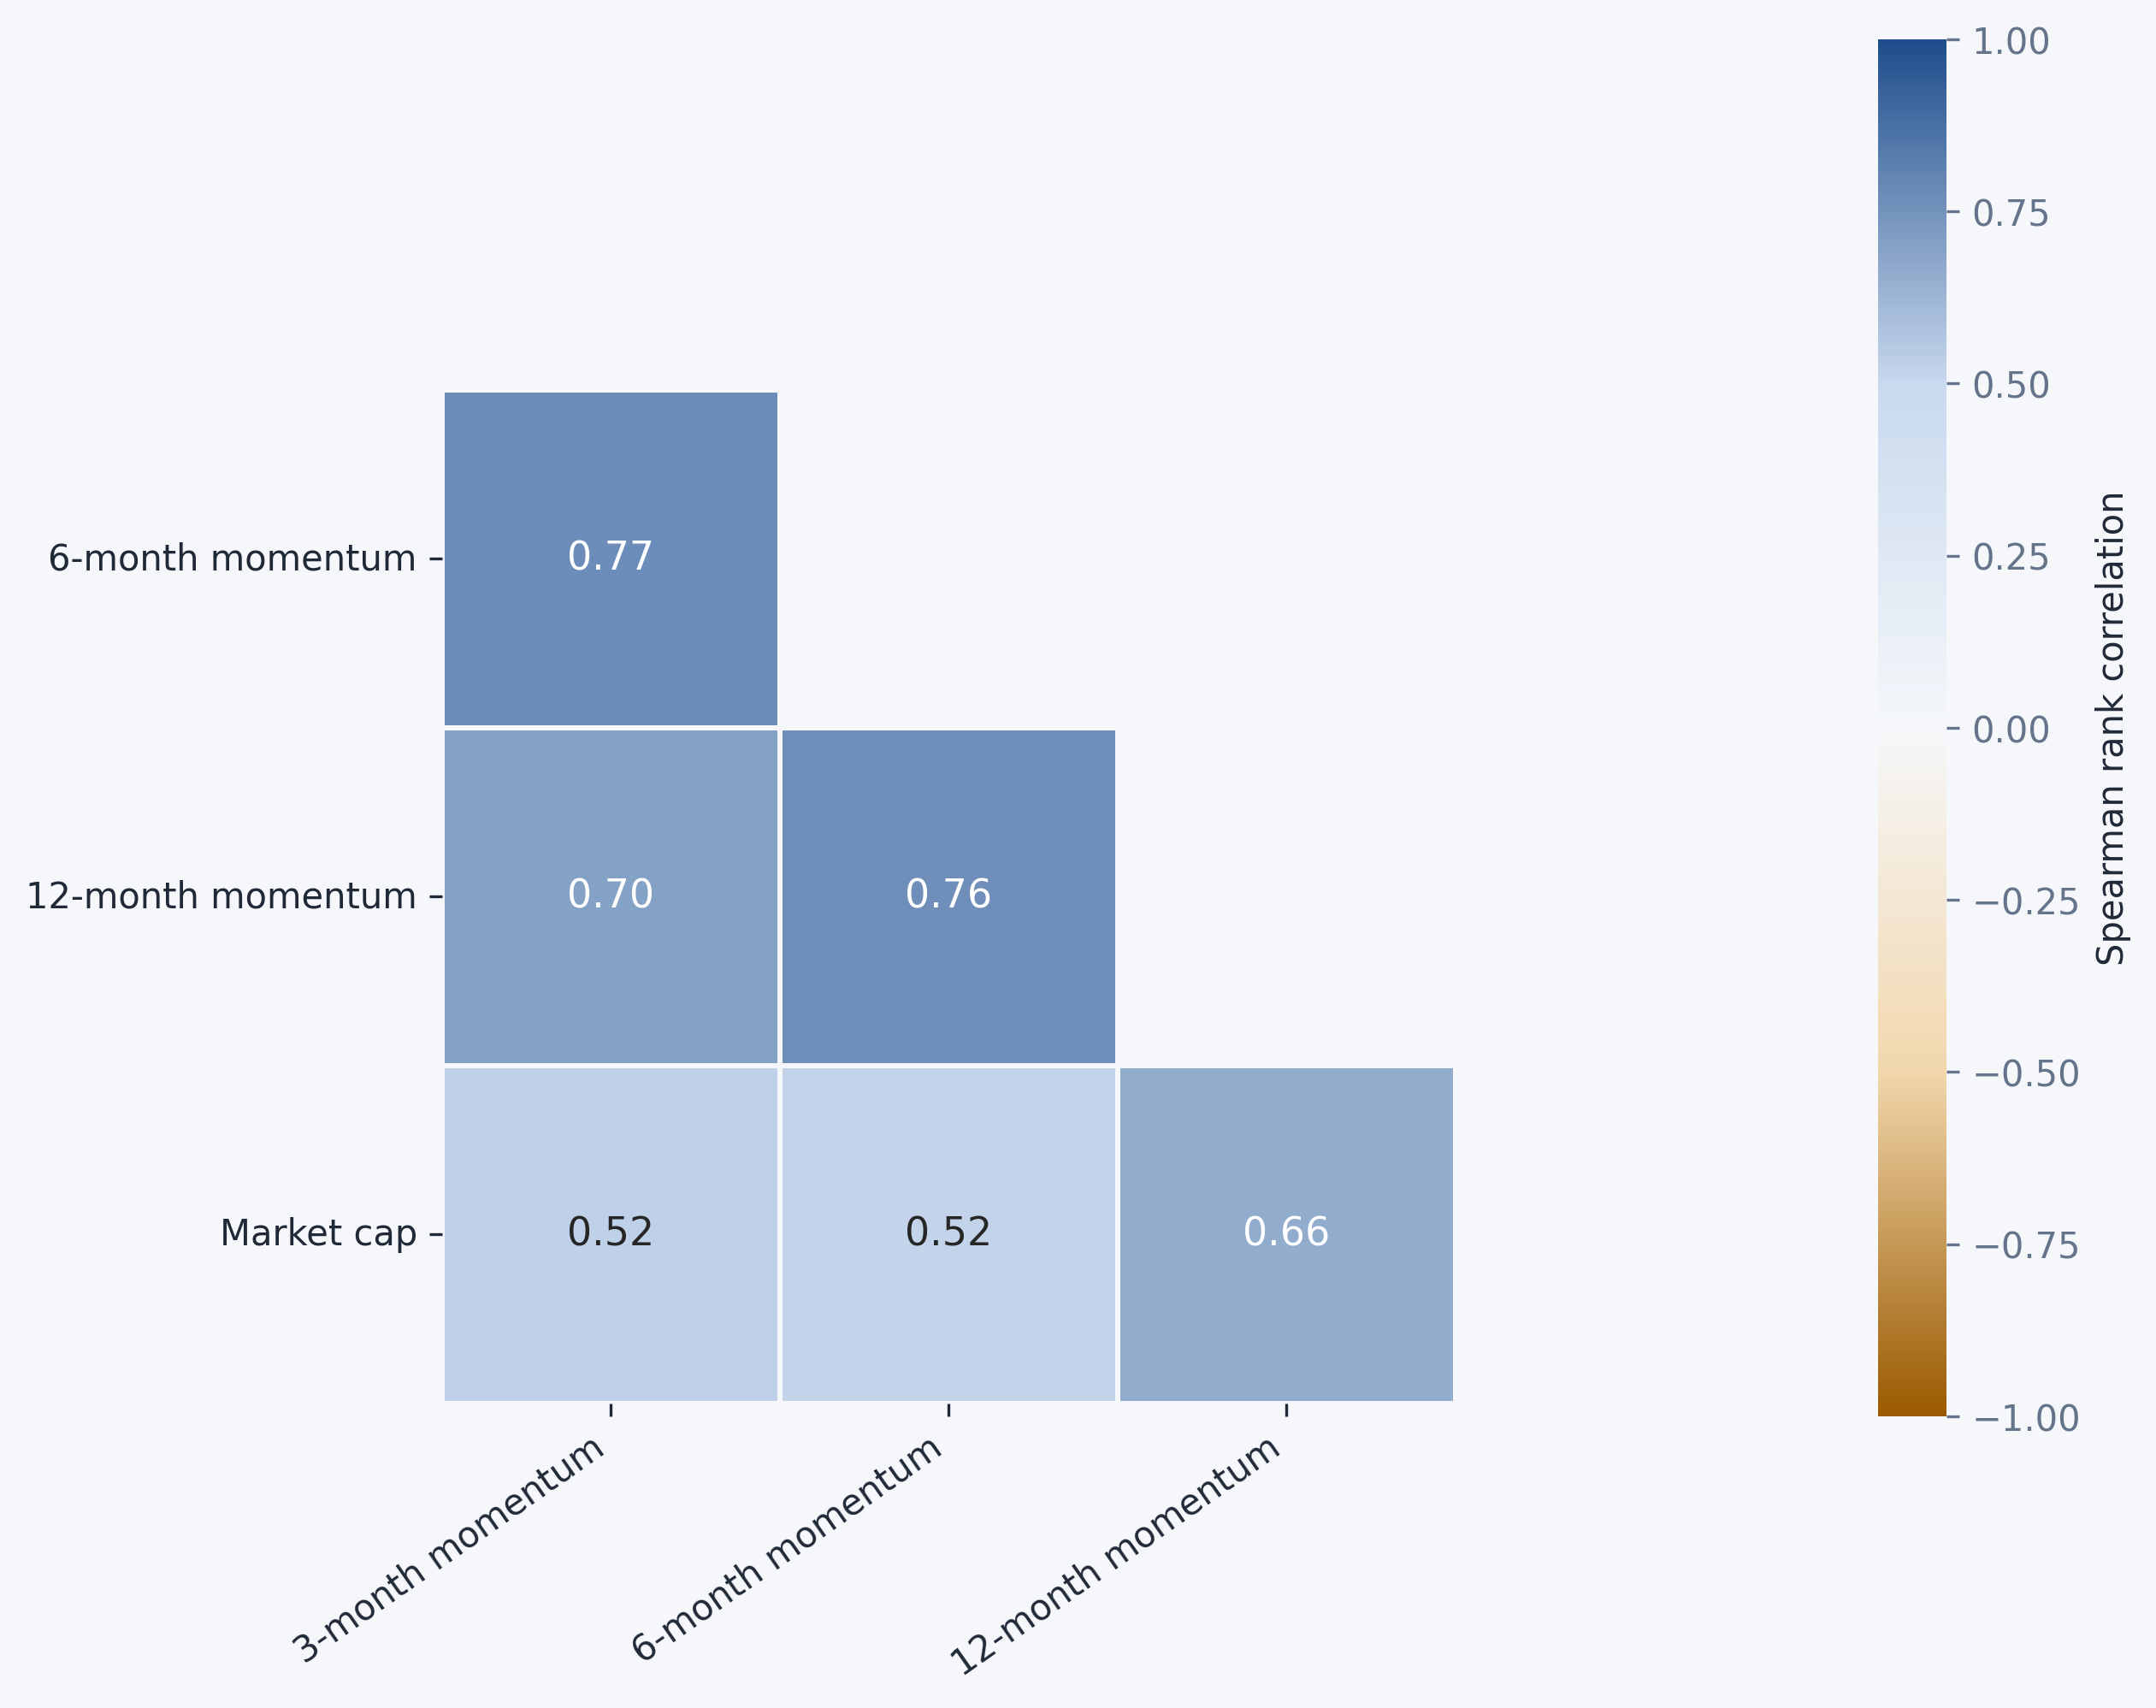
The three momentum factor-mimicking portfolios are strongly positively correlated, with pairwise correlations between 0.70 and 0.77, as expected given that they are constructed from overlapping return histories and capture the same underlying momentum effect over different horizons. Market capitalisation is also moderately positively correlated with all three momentum measures, most strongly with 12-month momentum (0.66), indicating that the size and momentum dimensions are not completely independent within this universe.
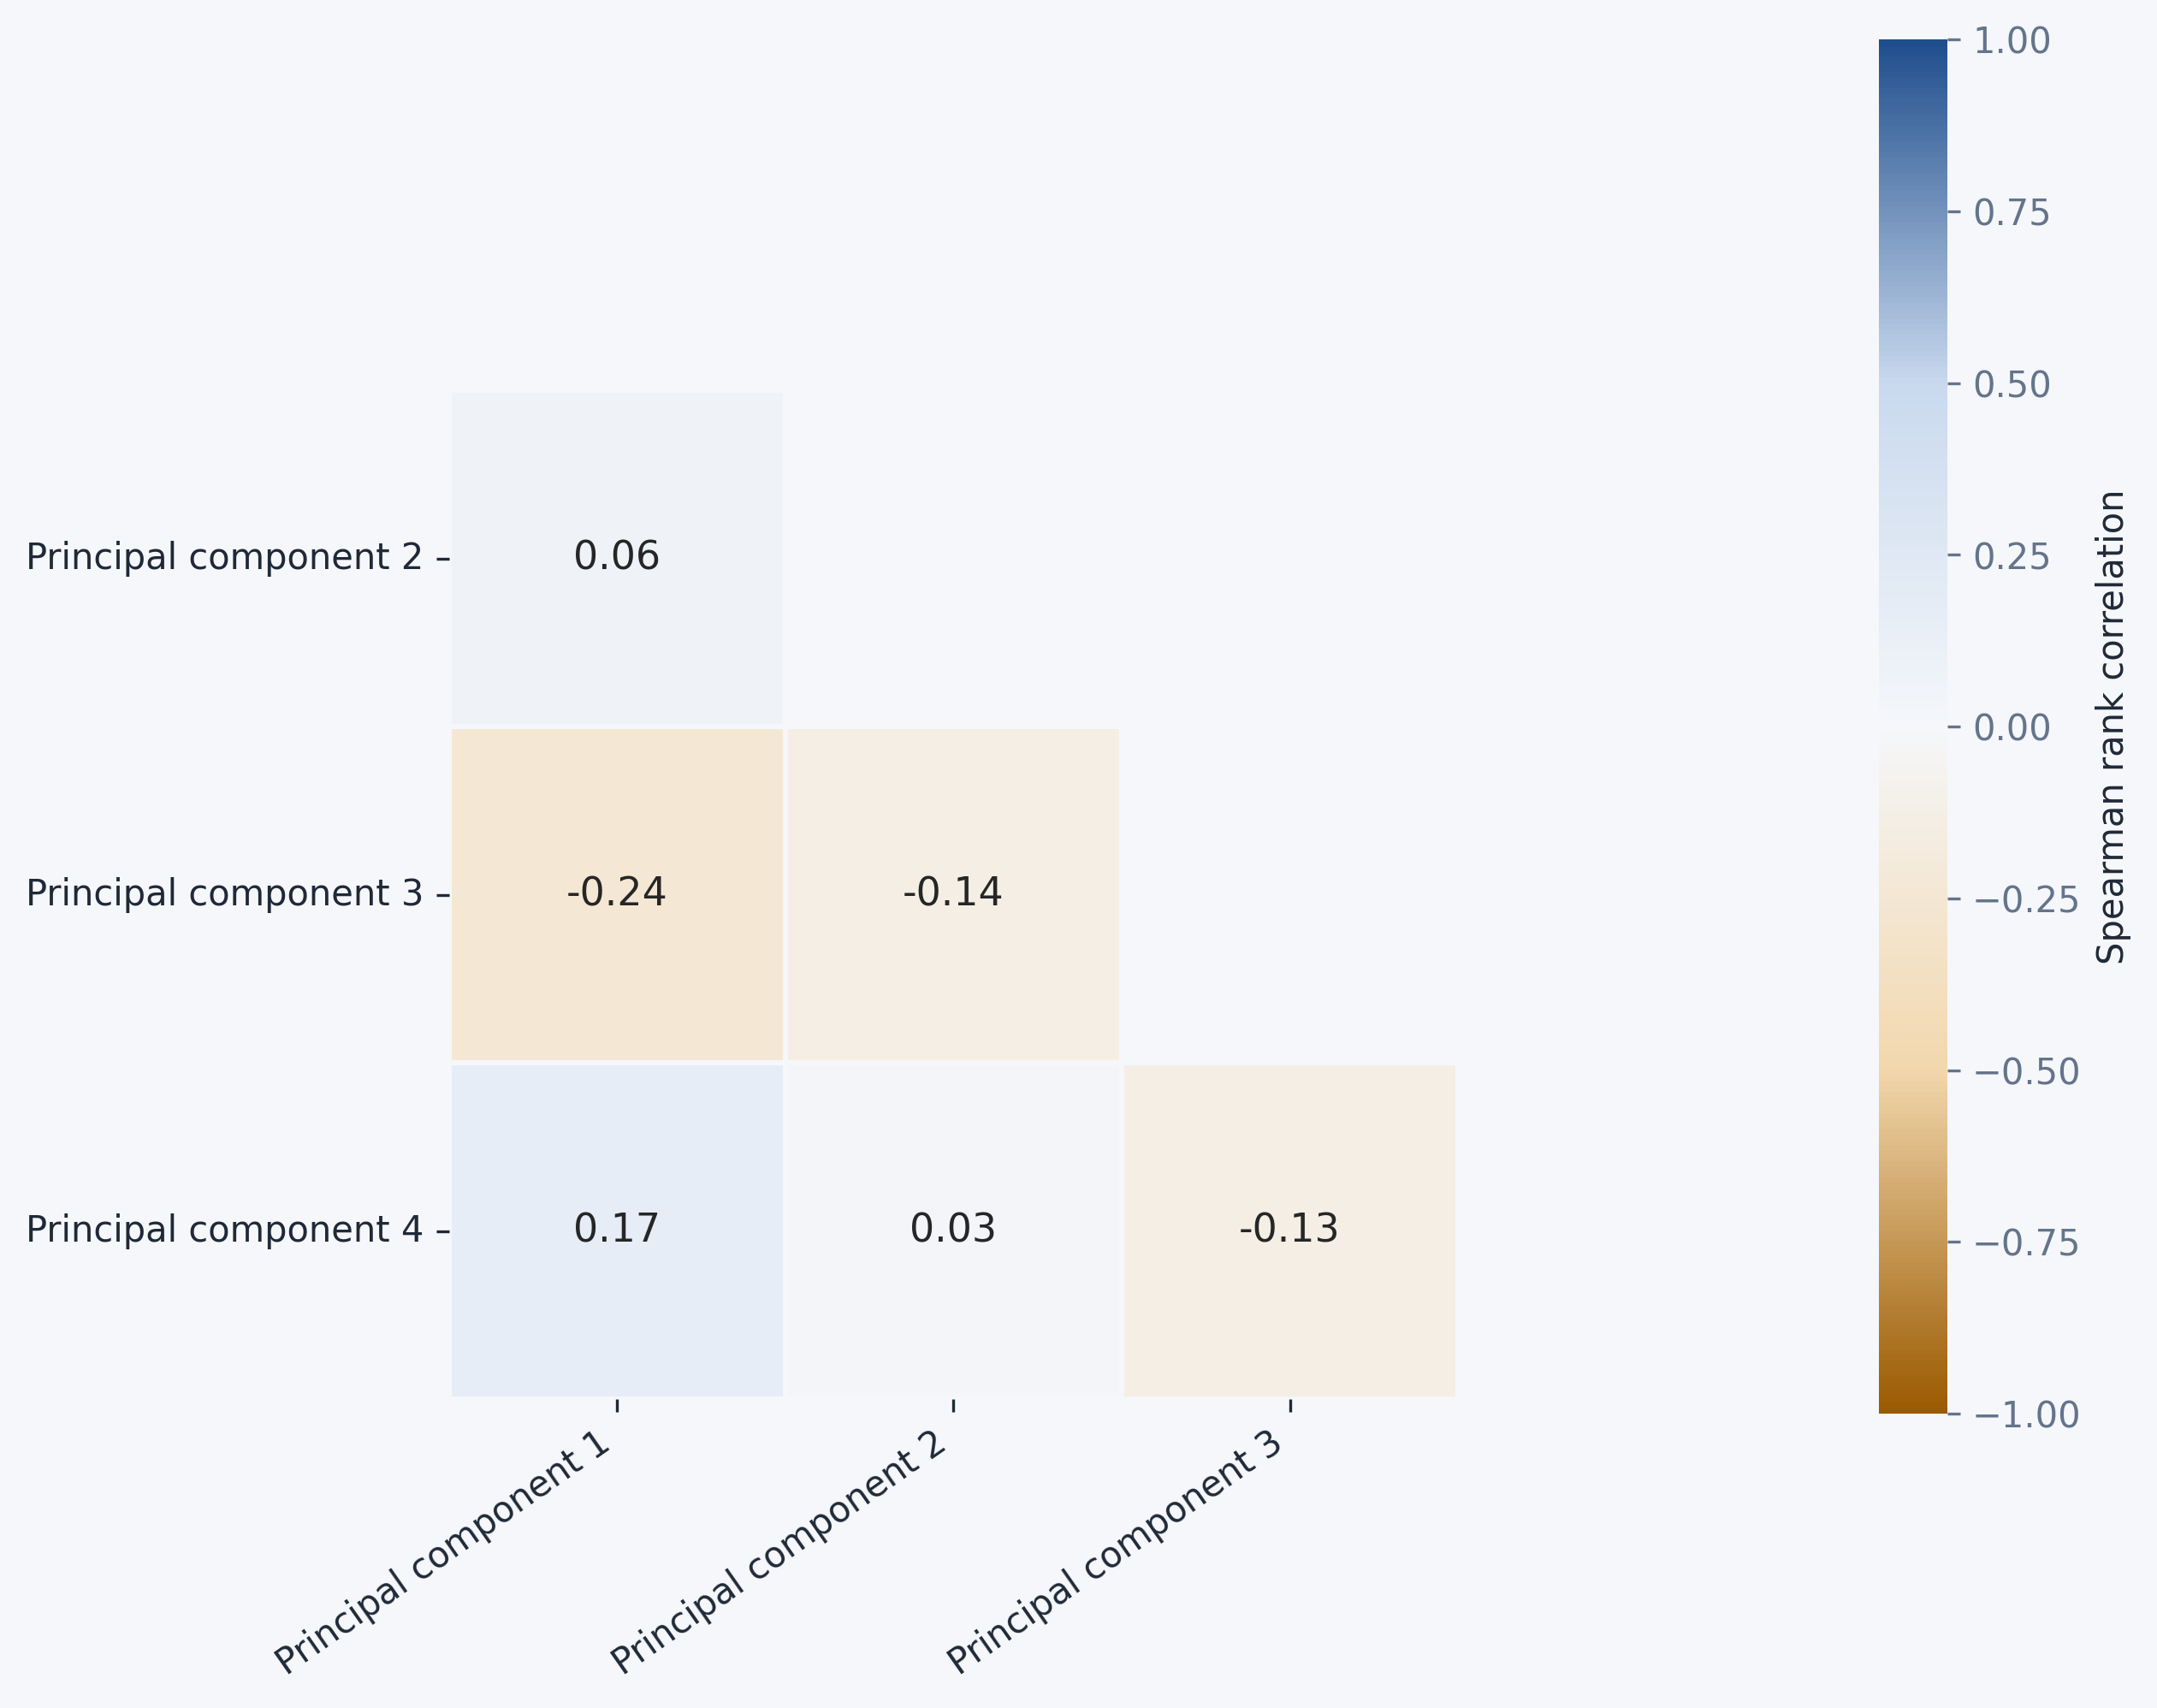
The Statistical FMPs exhibit very low correlations with each other. This is consistent with the orthogonality of the underlying principal components.