Equities Risk
More details on statistical factor mimicking portfolios
Synopsis
Here we present more details on the return characteristics of the factor mimicking portfolios designed to capture the influence of statistical variables. The portfolios are formed every December by sorting the universe of All Ordinaries Index stocks into terciles based on their loadings on the variable of interest. Each stock's loadings are calculated via exponentially-weighted moving average time-series regressions over the previous five years with decay parameter λ = 0.95. The factor mimicking portfolio returns are the monthly return spread between the top tercile portfolio and the bottom tercile portfolio. Relative volatility is the ratio of the factor mimicking portfolio volatility to the volatility of the return spread of randomly assigned tercile portfolios.
| Factor | Minimum | 25th percentile | 75th percentile | Maximum | Standard deviation | Relative volatility |
|---|---|---|---|---|---|---|
| Principal component 1 | -0.202 | -0.035 | 0.036 | 0.193 | 0.062 | 2.902 |
| Principal component 2 | -0.131 | -0.039 | 0.033 | 0.193 | 0.054 | 2.519 |
| Principal component 3 | -0.101 | -0.025 | 0.022 | 0.105 | 0.035 | 1.641 |
| Principal component 4 | -0.094 | -0.017 | 0.021 | 0.107 | 0.032 | 1.507 |
Factor mimicking portfolio total return indices
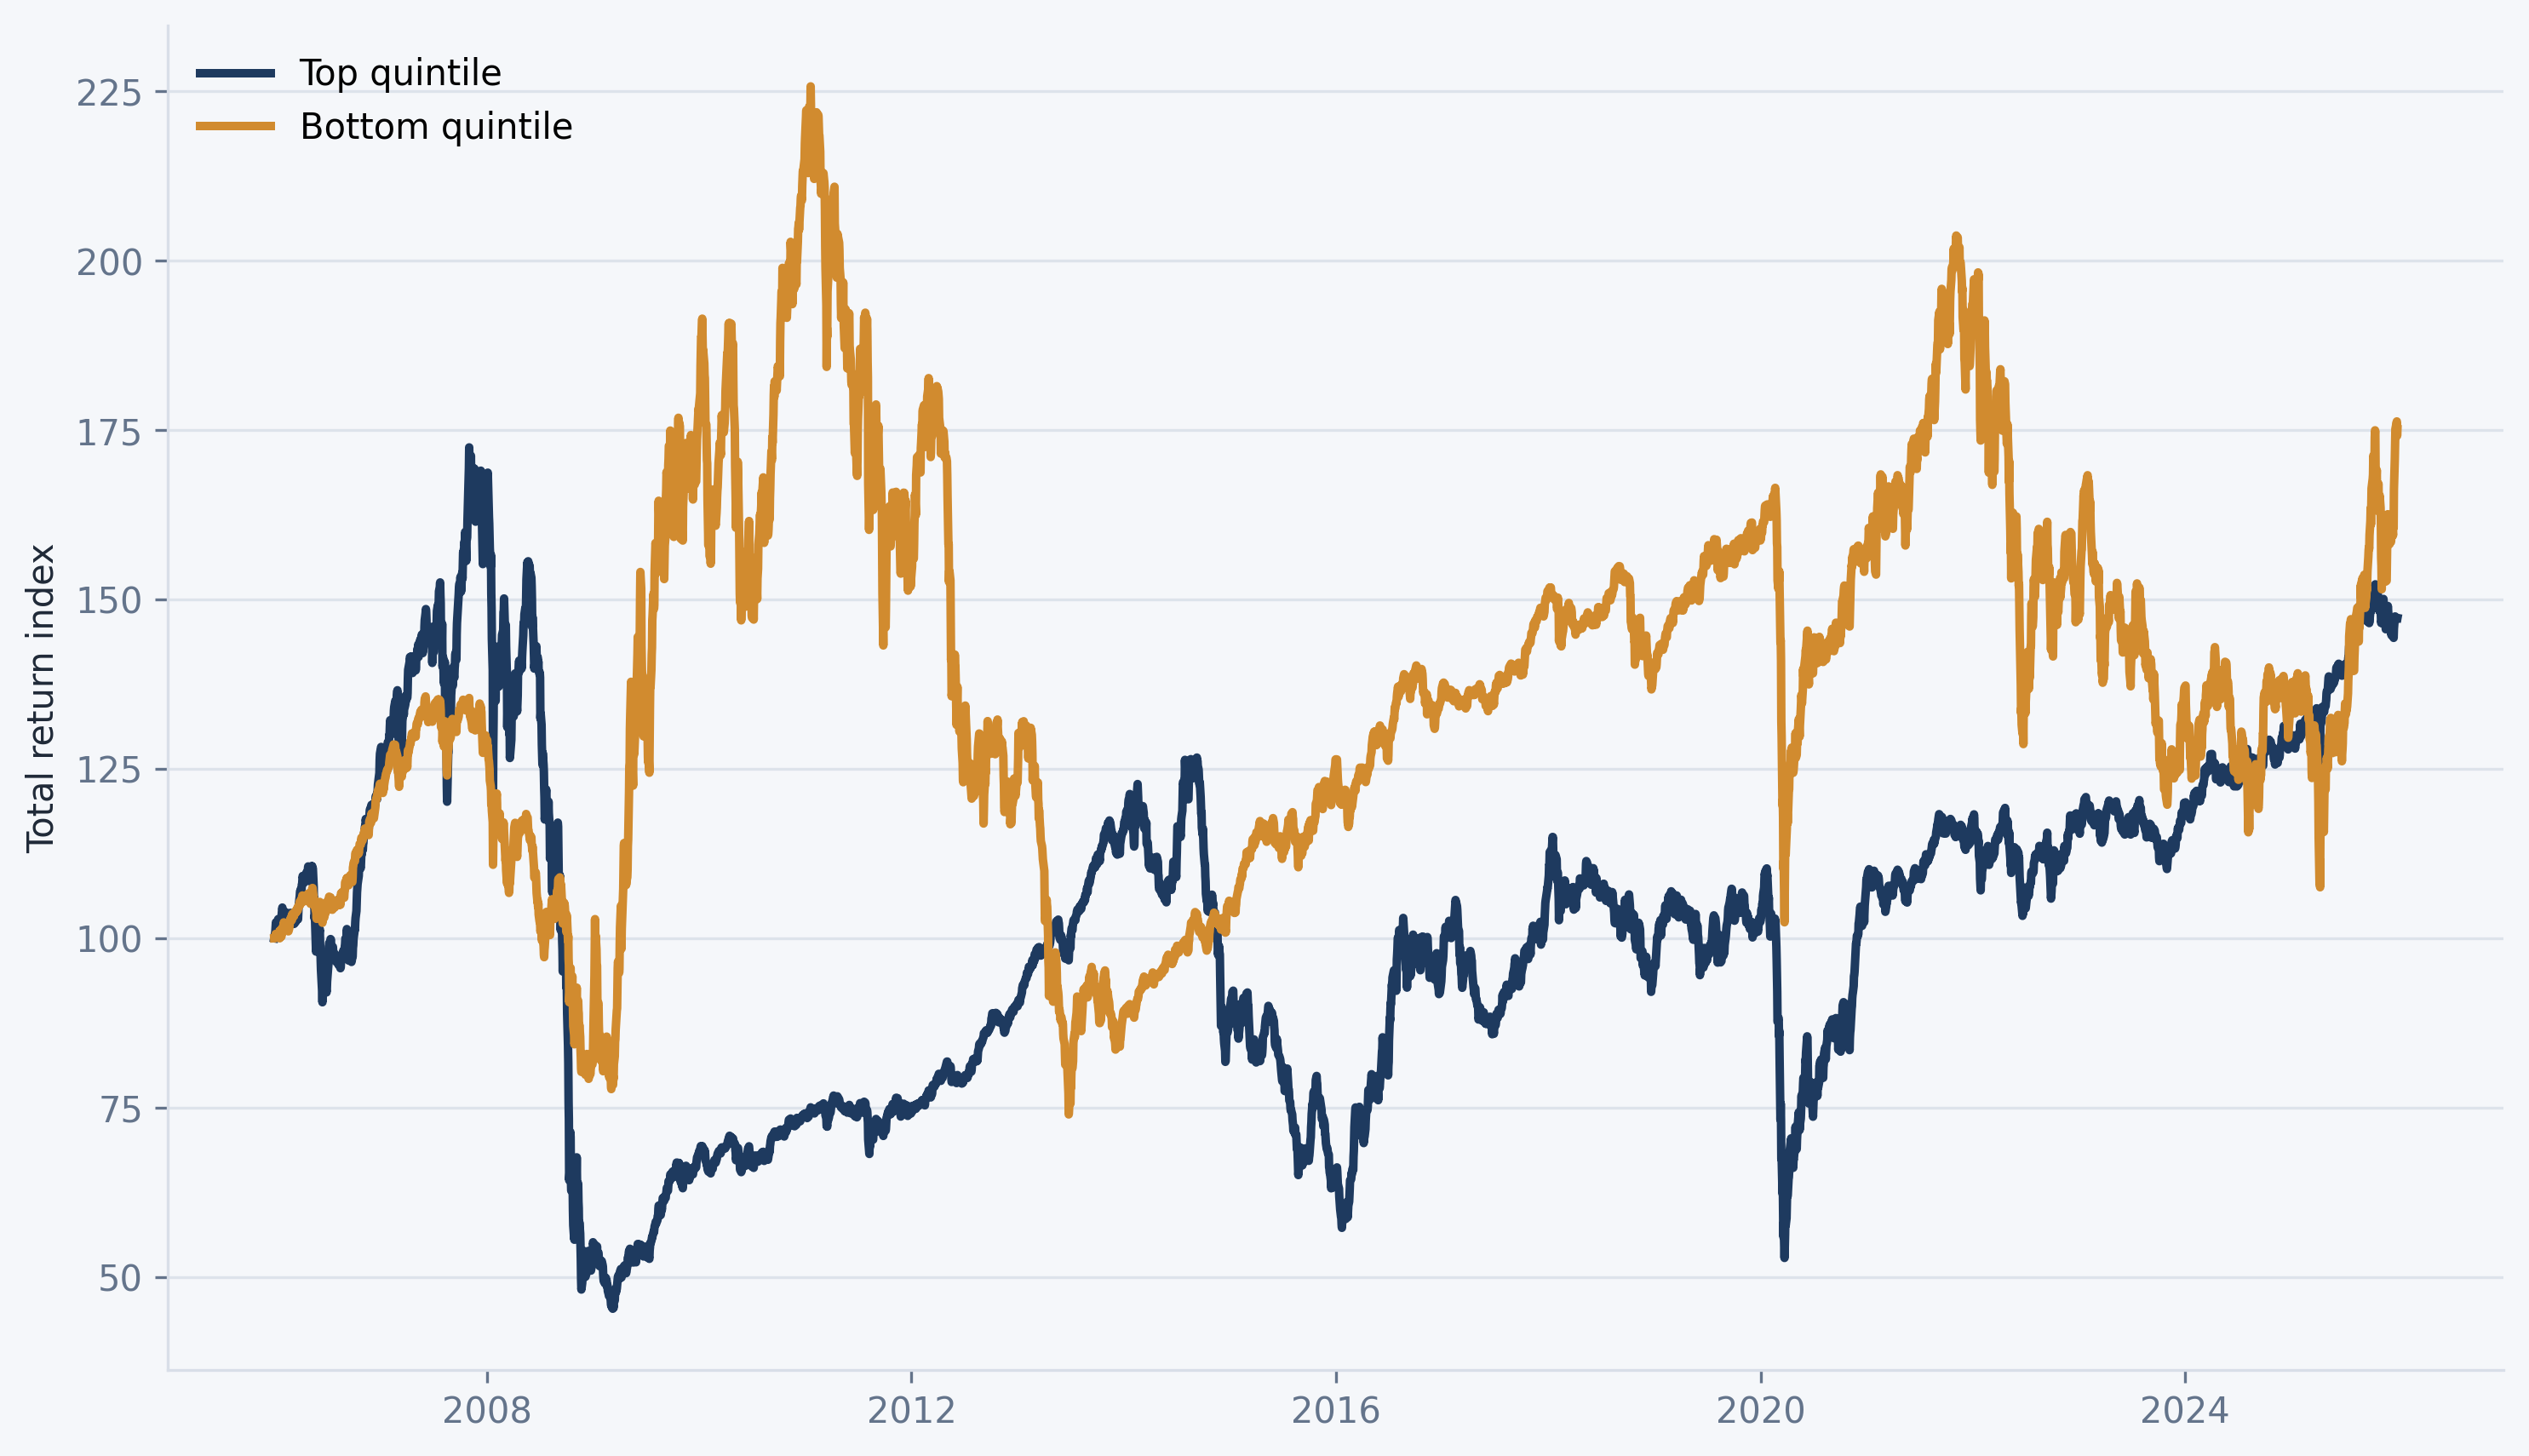
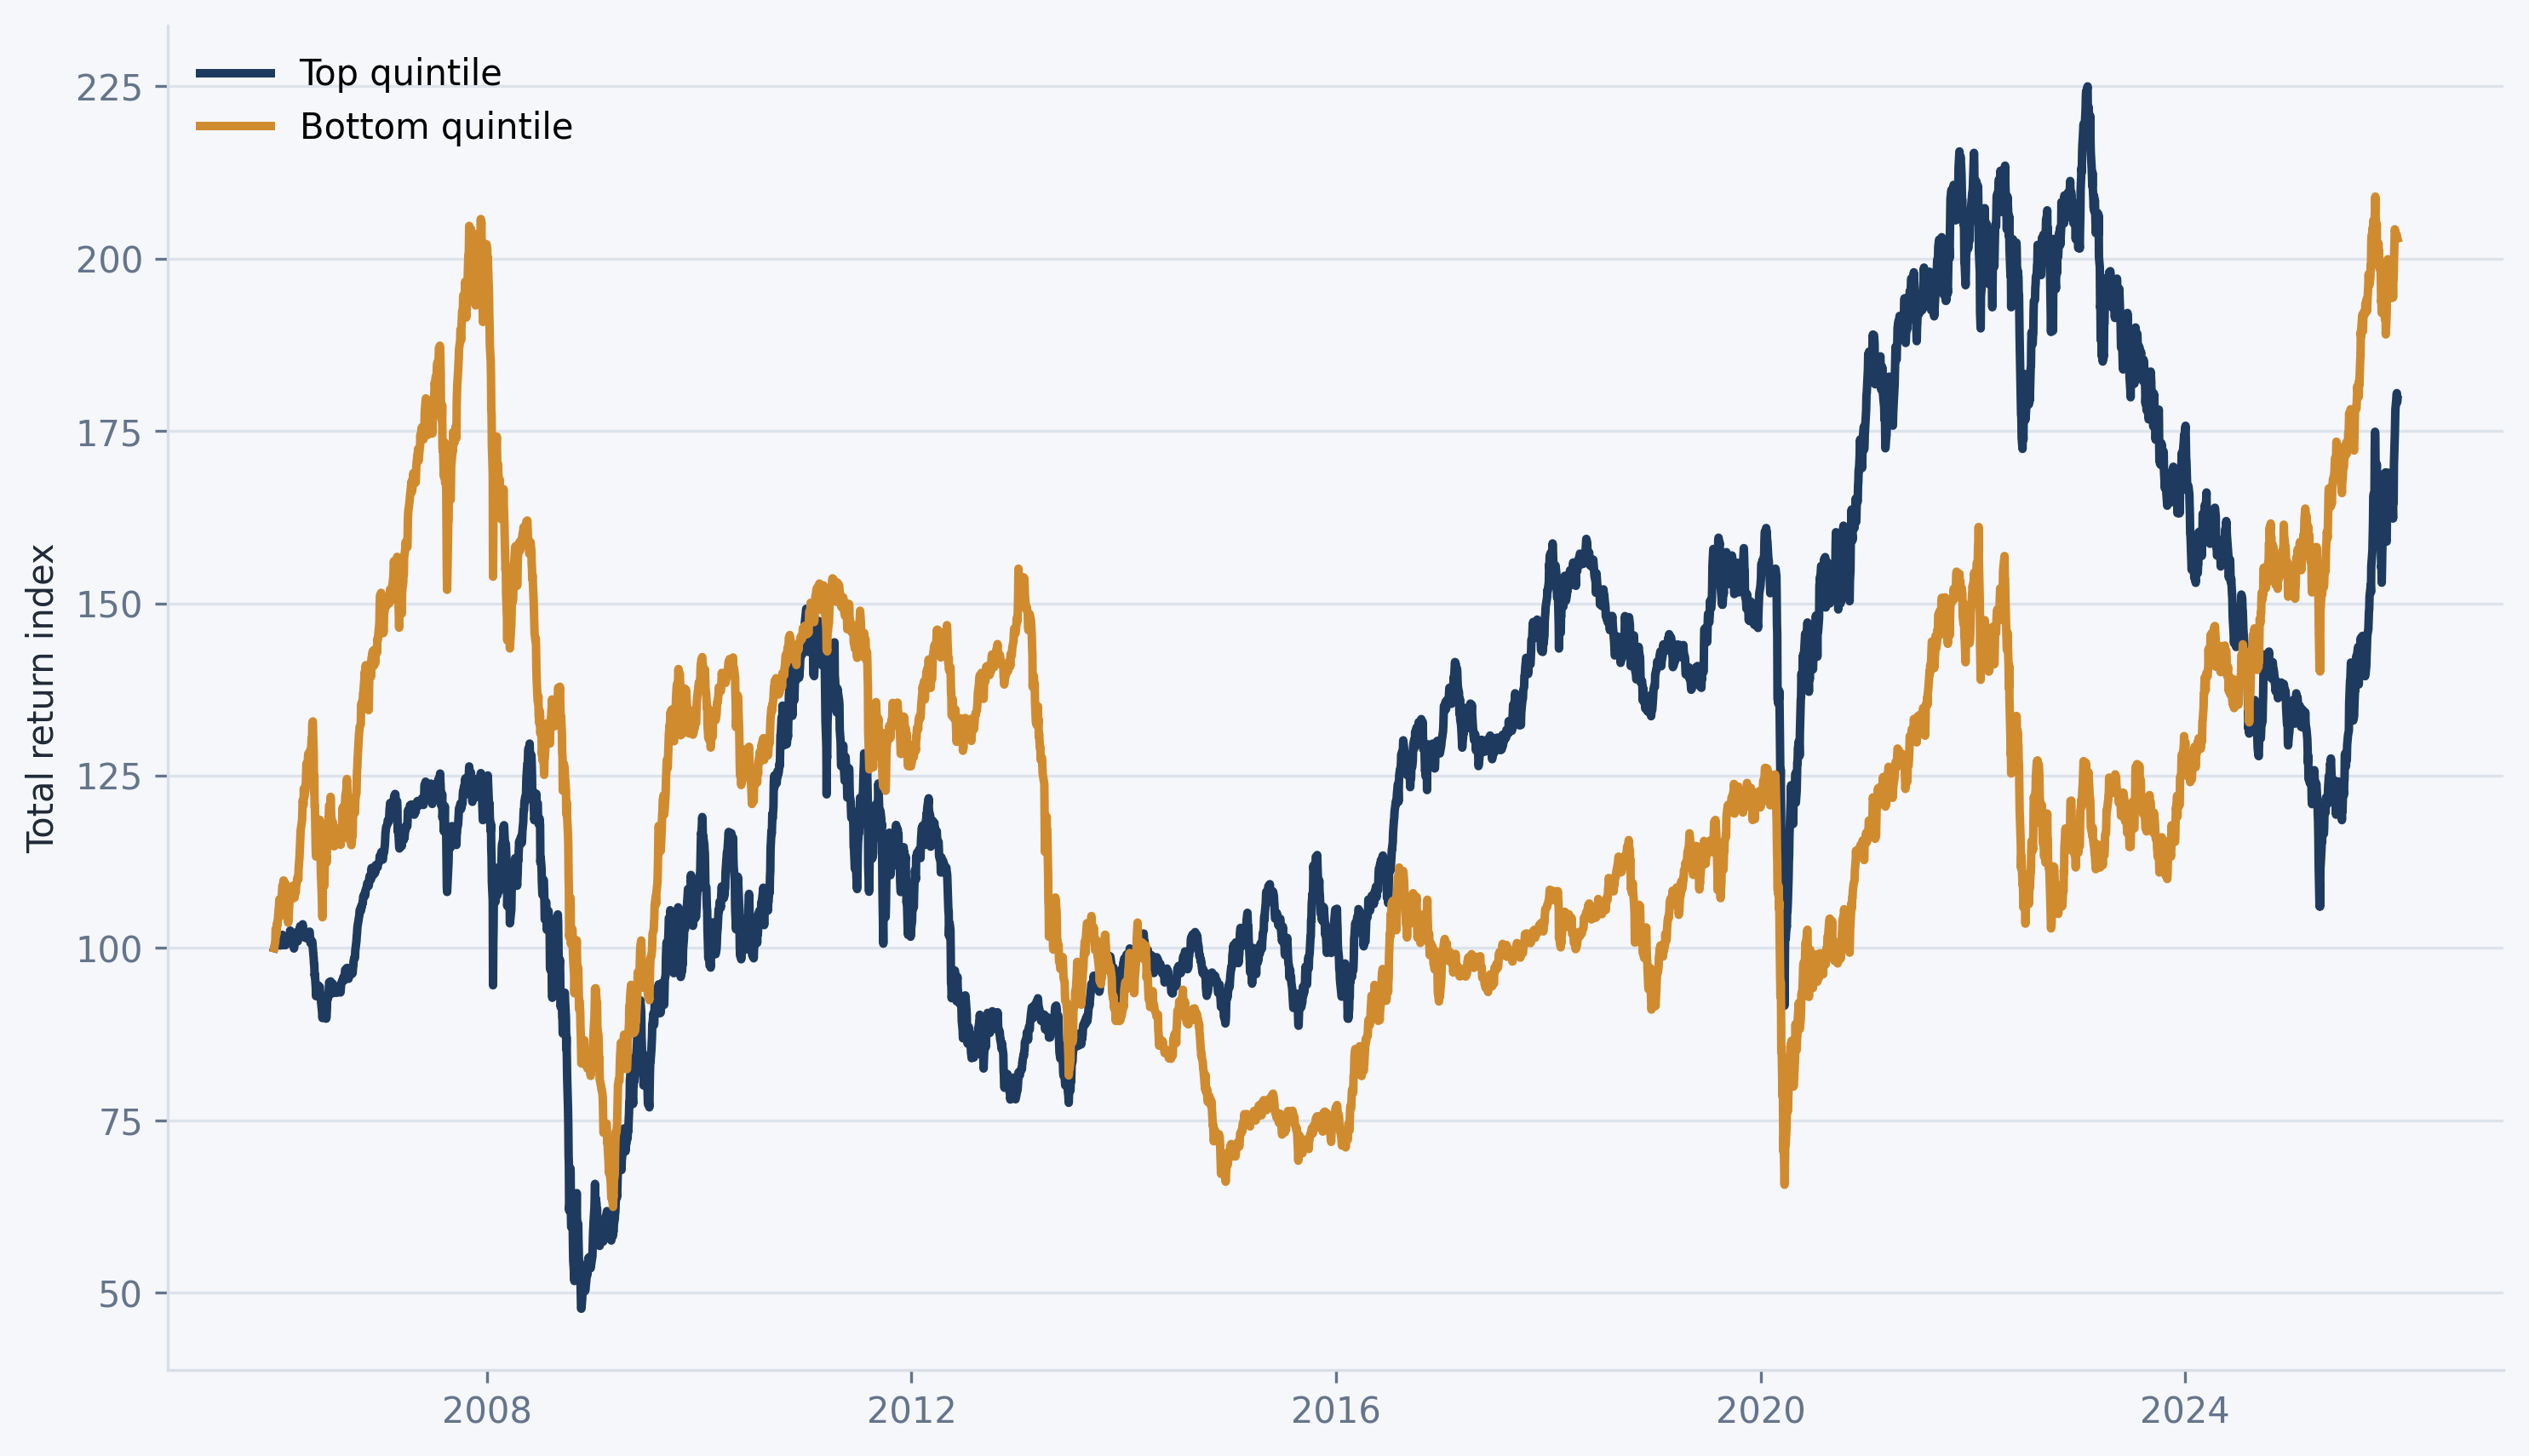
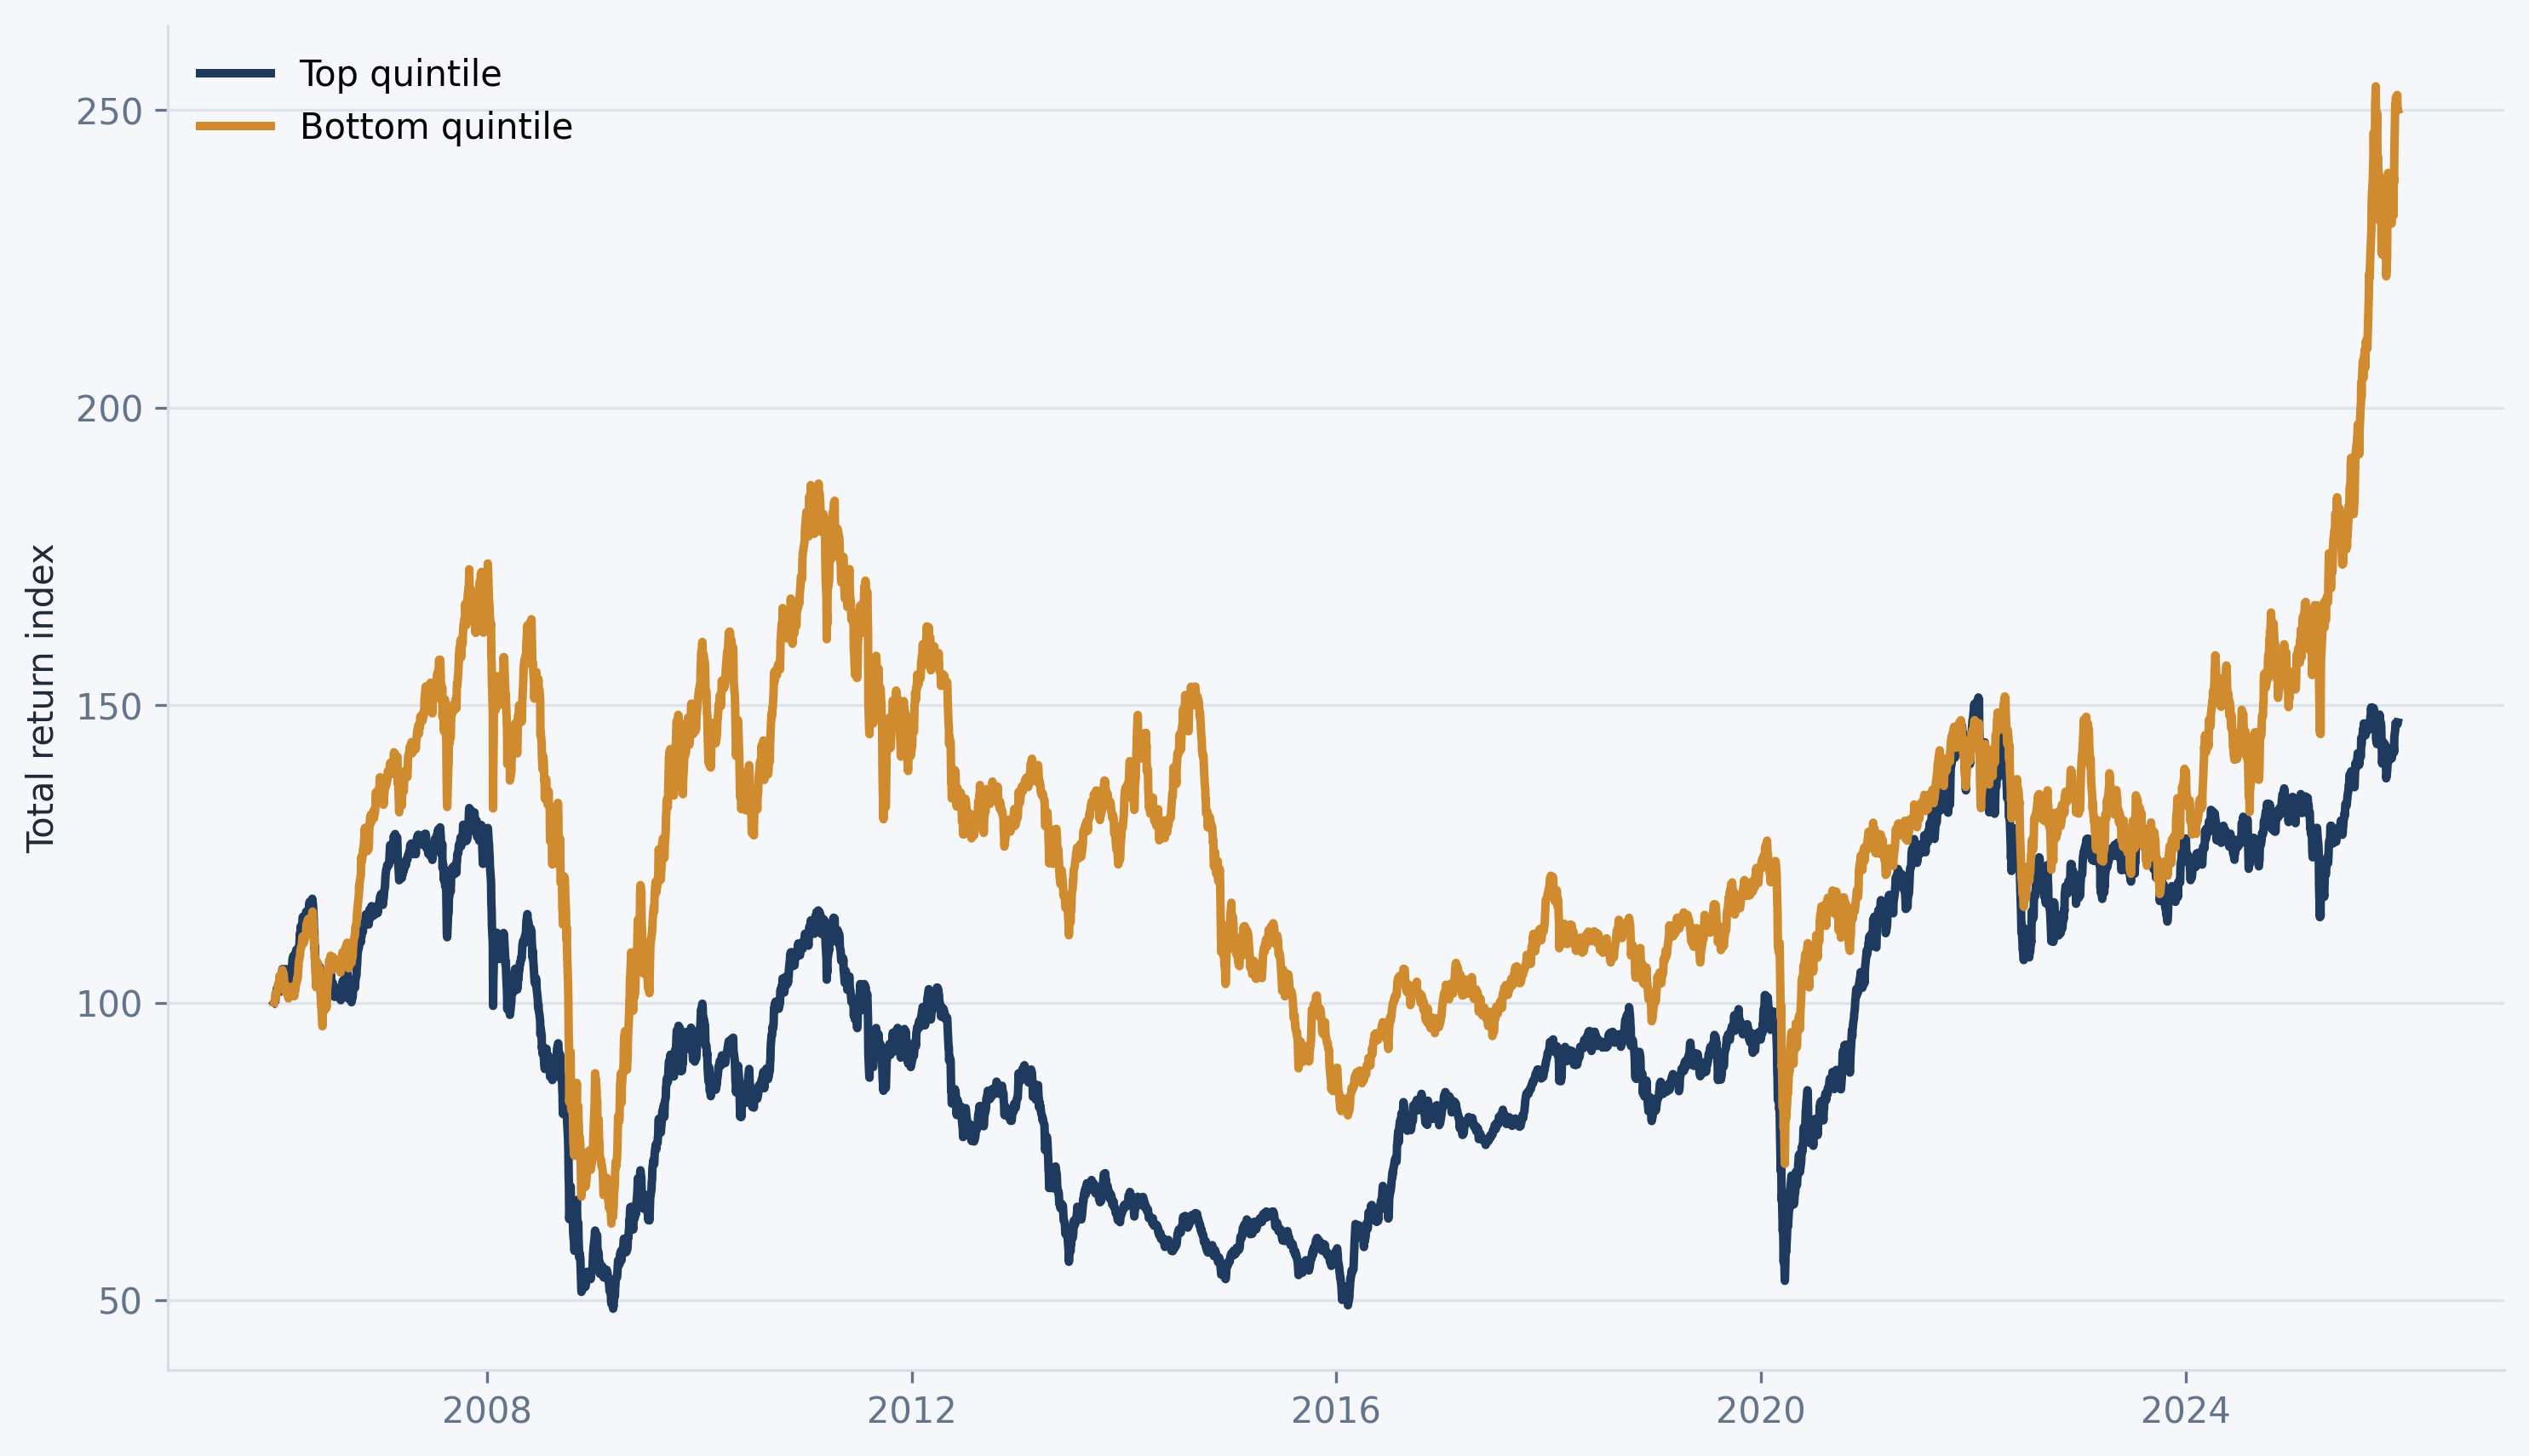
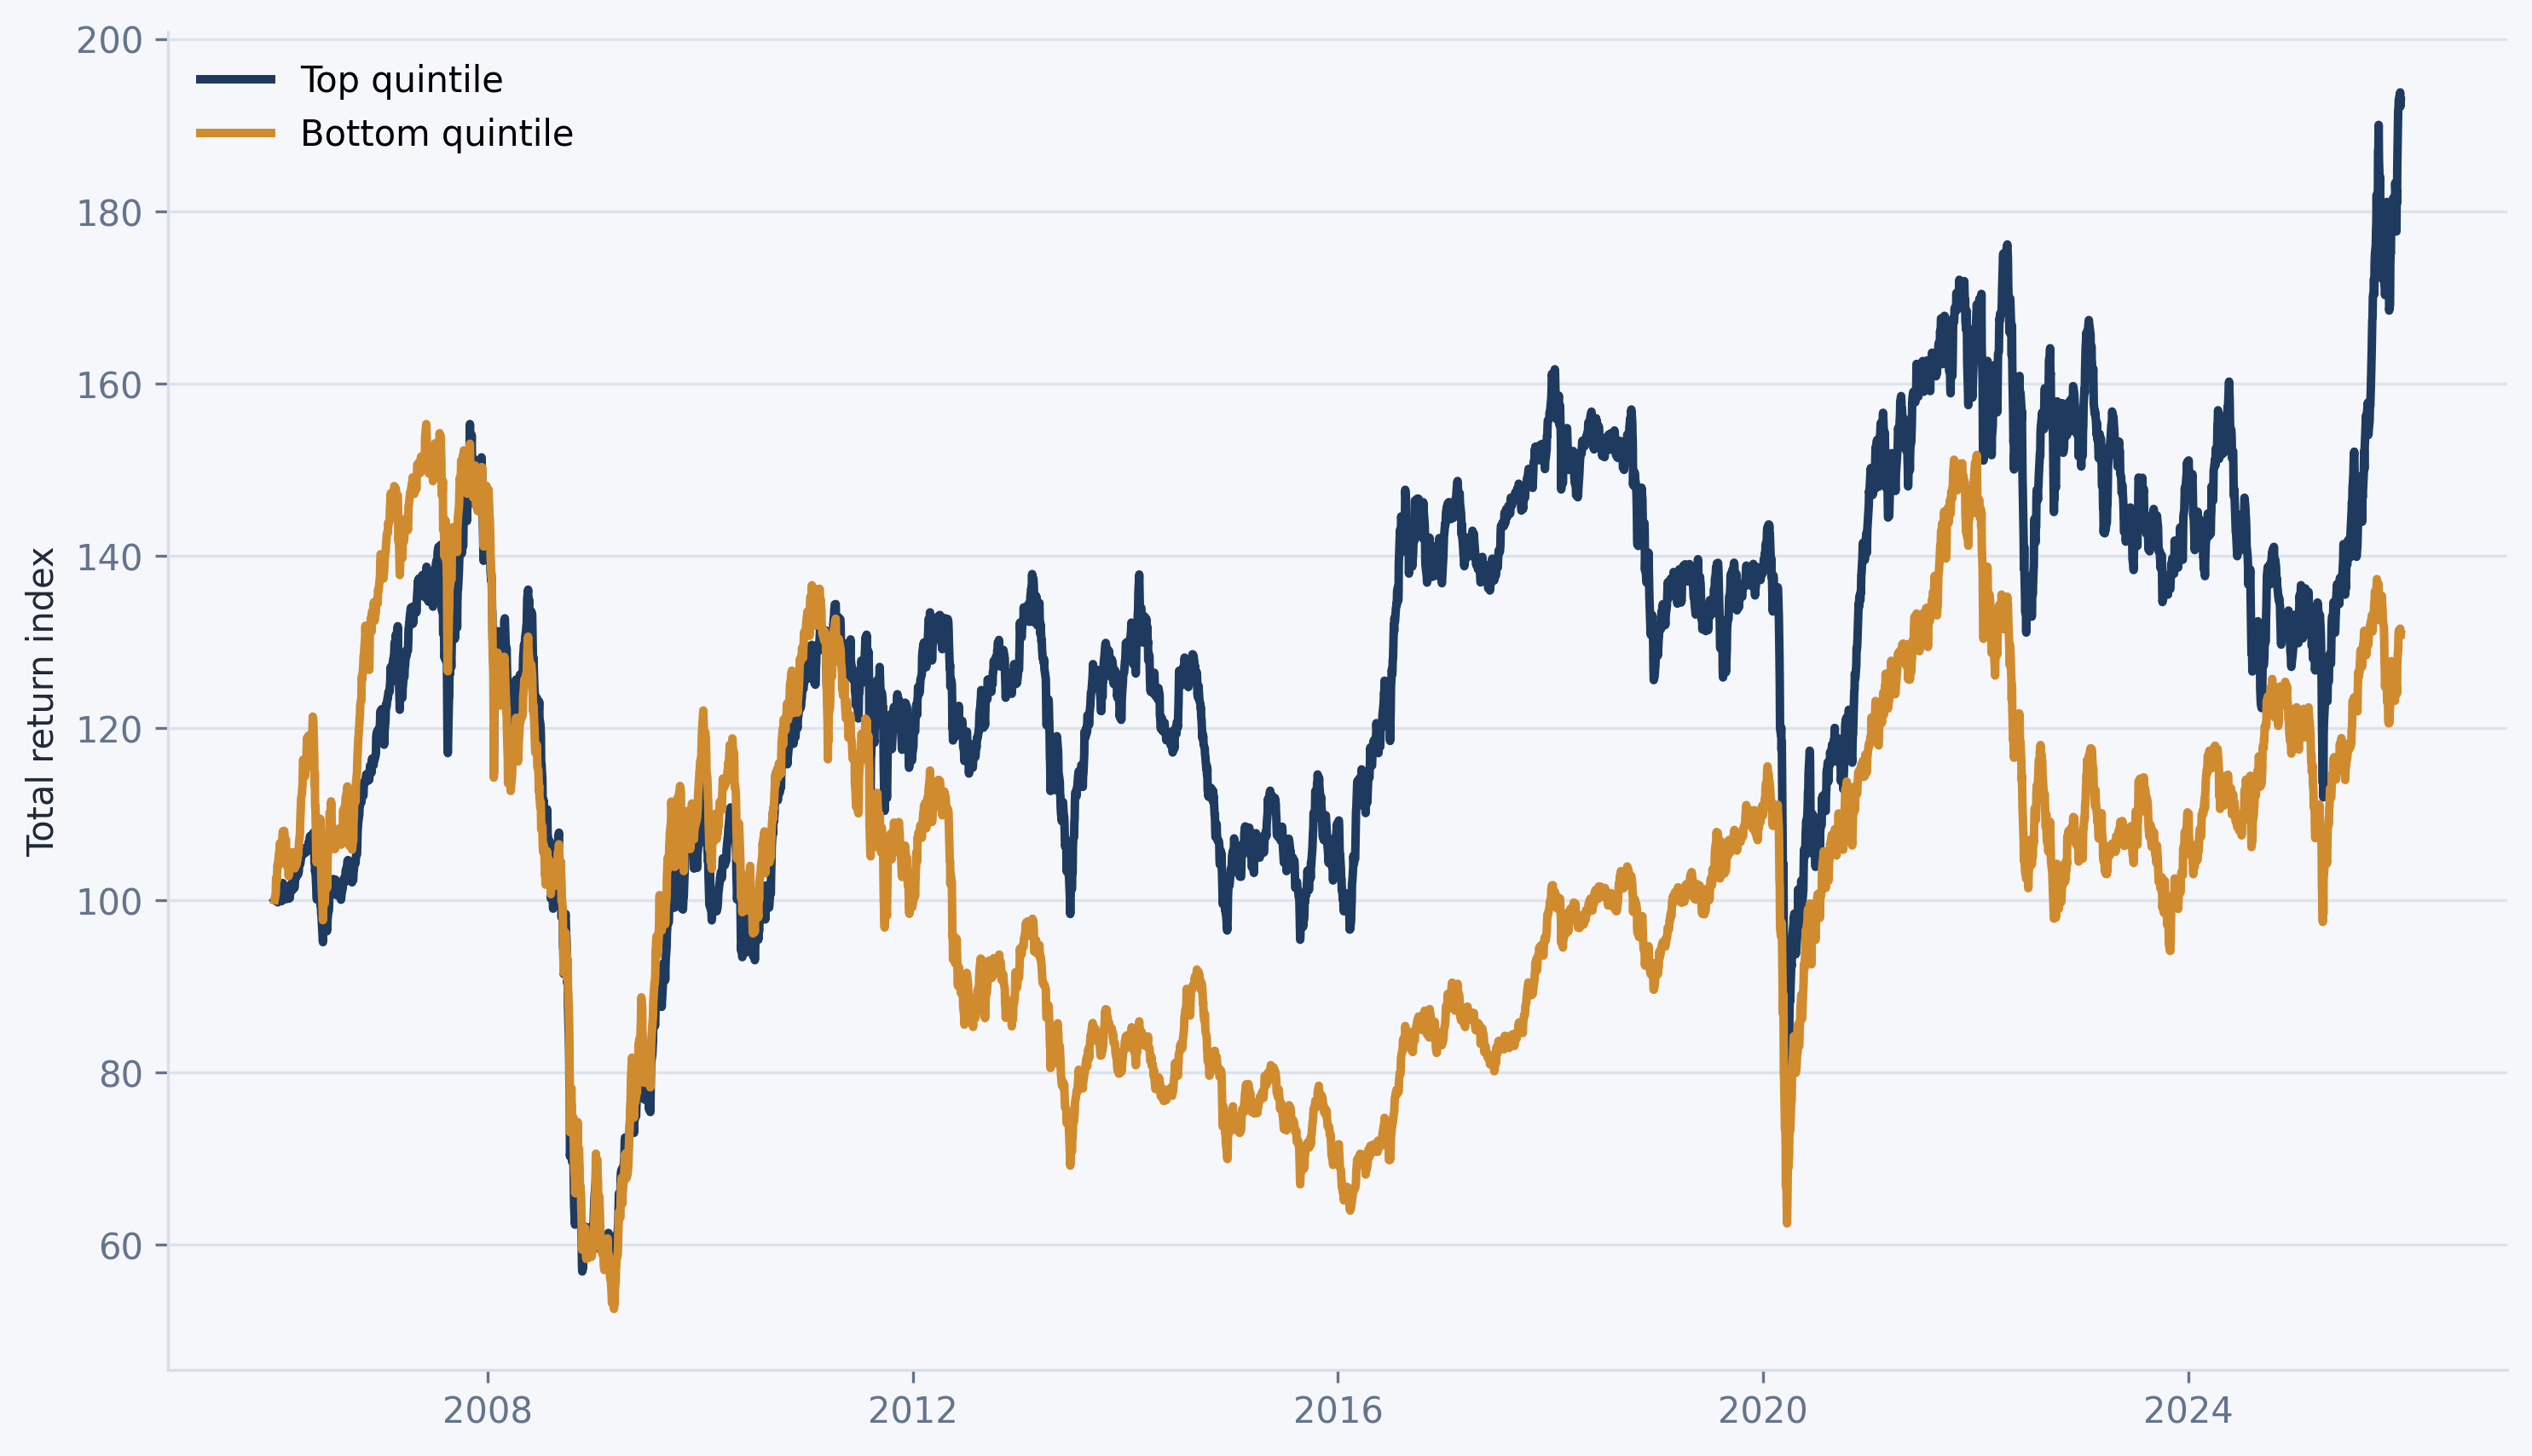
Principal components 1-4 are the loadings on the first four principal components estimated using the Asymptotic Principal Components method of Connor and Korajczyk (1988), Risk and Return in an Equilibrium APT: Application of a New Test MethodologyJournal of Financial Economics, 21(2), 255–289.